
3 Clues The S&P 500 Is Warming Up For A Breakout

Image Source: Pixabay
Watch the video from the WLGC session on 11 Jun 2025 to find out the following:
- What do the recent reactions around the 6,000 level really tell us about supply and demand?
- How does this ascending triangle or volatility contraction pattern hint at a bigger move ahead?
- Why is the lack of strong volume on the breakout still worth paying attention to?
- And a lot more…
Video Length: 00:03:31
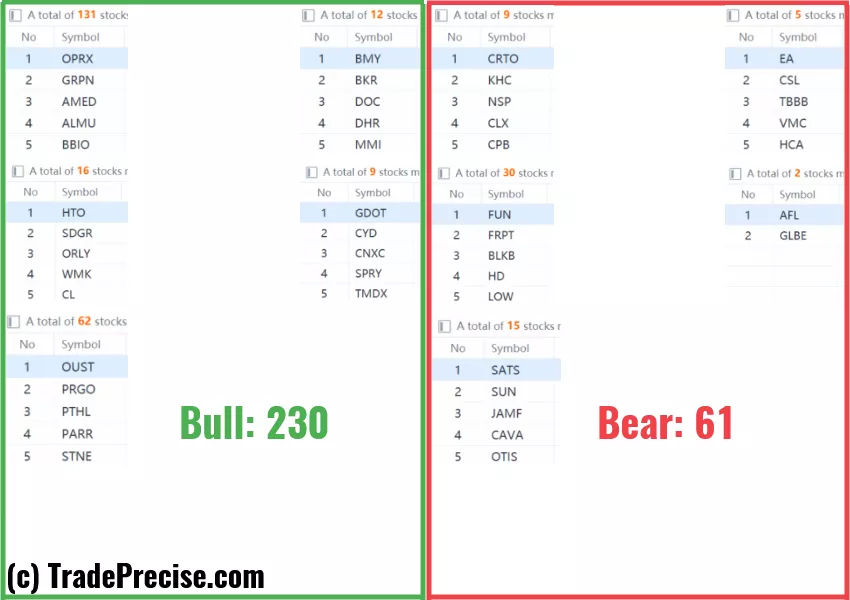
Market Environment
The bullish vs. bearish setup is 230 to 61 from the screenshot of my stock screener below.
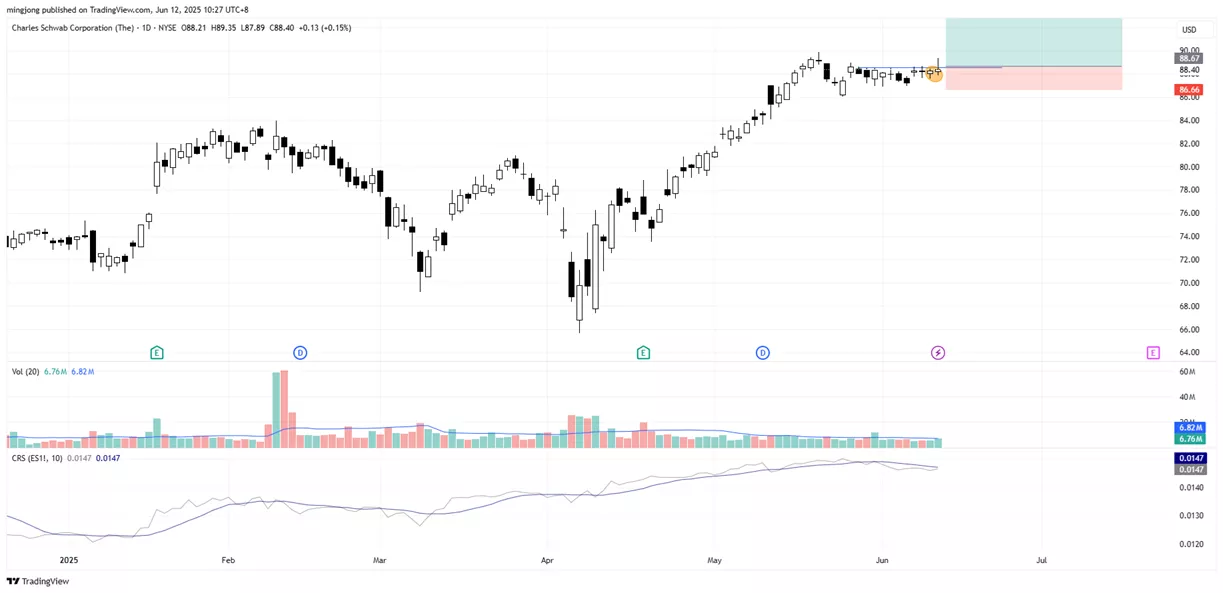
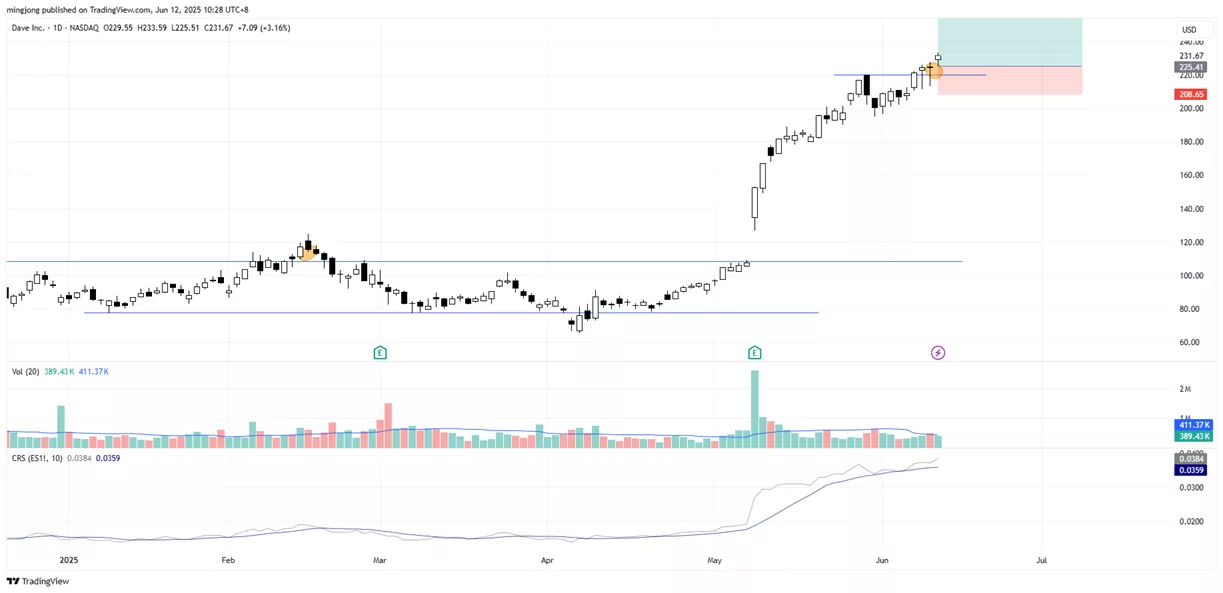
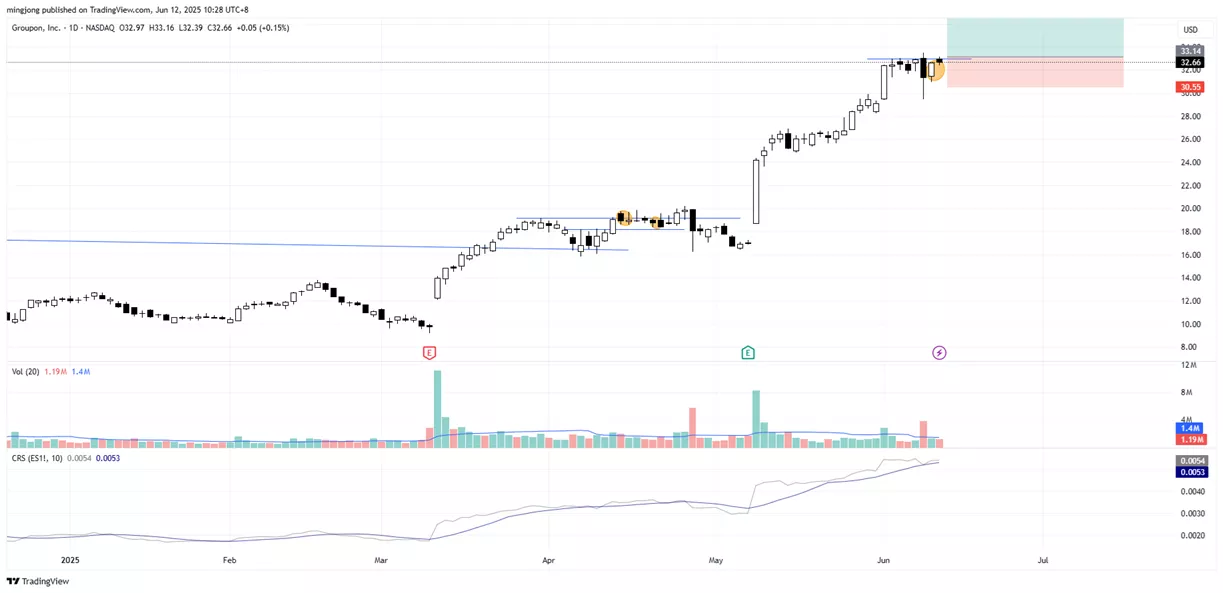
3 Stocks Ready To Soar
21 actionable setups such as SCHW DAVE GRPN were discussed during the live session on 11 Jun 2025 before the market open (BMO).
(Click on image to enlarge)
(Click on image to enlarge)
(Click on image to enlarge)
More By This Author:
Rejection, Recoil… And Ready To Rip? Is A Massive Breakout About To Hit?
This Chart Pattern Just Flashed A Hidden Demand Signal - Is The Market Ready To Rip Higher?
This Support Zone Could Be The Launchpad For New Highs — Are You Watching It?
Disclaimer: The information in this presentation is solely for educational purpose and should not be taken as investment advice.


