
Several major U.S. stock market indices have bounced (rallied) over the past 2 months. But these moves higher are facing a major test right now.
And considering that we are in a bear market… these are just bounces until more constructive rallies take place with major resistance levels breaking along the way.
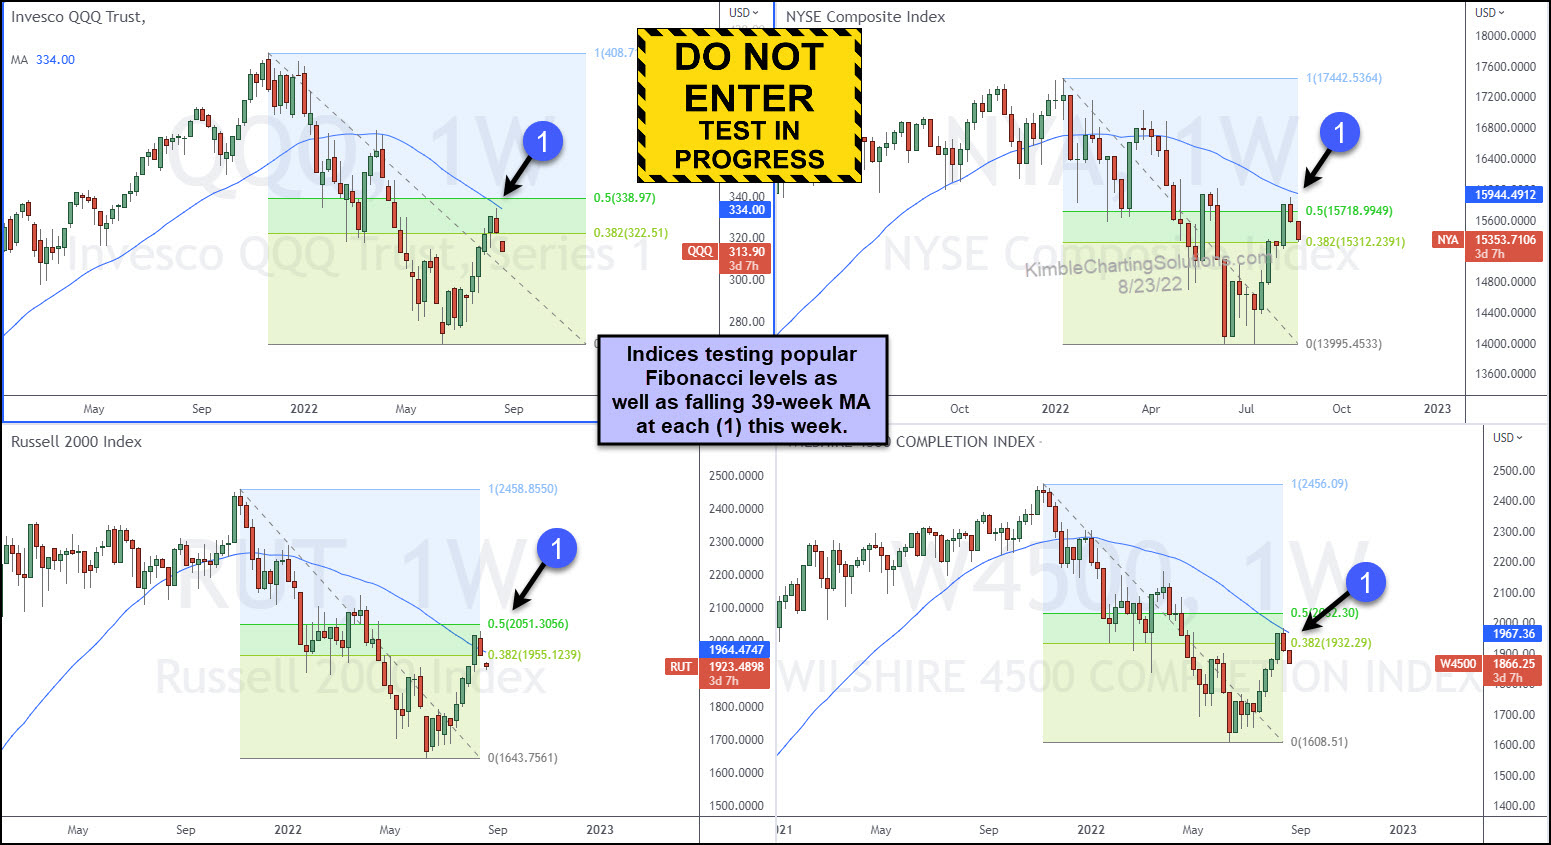
Today, we share a chart 4-pack that highlights important Fibonacci resistance levels on 4 major U.S. stock market indices.
These indices include the Nasdaq 100 ETF (QQQ), NYSE Composite, Russell 2000, and Wilshire 4500. Each of them tested the 50% Fibonacci retracement level at (1) and reversed lower. Yikes!
These reversals also took place at the falling 39-week moving average for each index. Let’s just call this a “slow down” construction zone. Should these resistance levels hold firm, it could mean a pullback… or another leg lower. Careful here.
Several important tests are in play for the U.S. stock market at the same time.
(Click on image to enlarge)
More By This Author:
Are Market-Leading Semiconductors Reversing Lower Once Again?
Are Crude Oil Prices Creating A Double Top Price Peak?
Semiconductors ETF (SMH) Trading Near Fibonacci Inflection Point


Comments
Log in or sign up to join the conversation.