
We talk a lot about the importance of watching the performance of market leading stocks and sectors. And just last week we highlighted that the Semiconductor Sector (SMH) was nearing its 38.2% Fibonacci level.
Well, that level is already showing its importance and has given the rally pause. Could it lead to a pullback or another strong move lower?
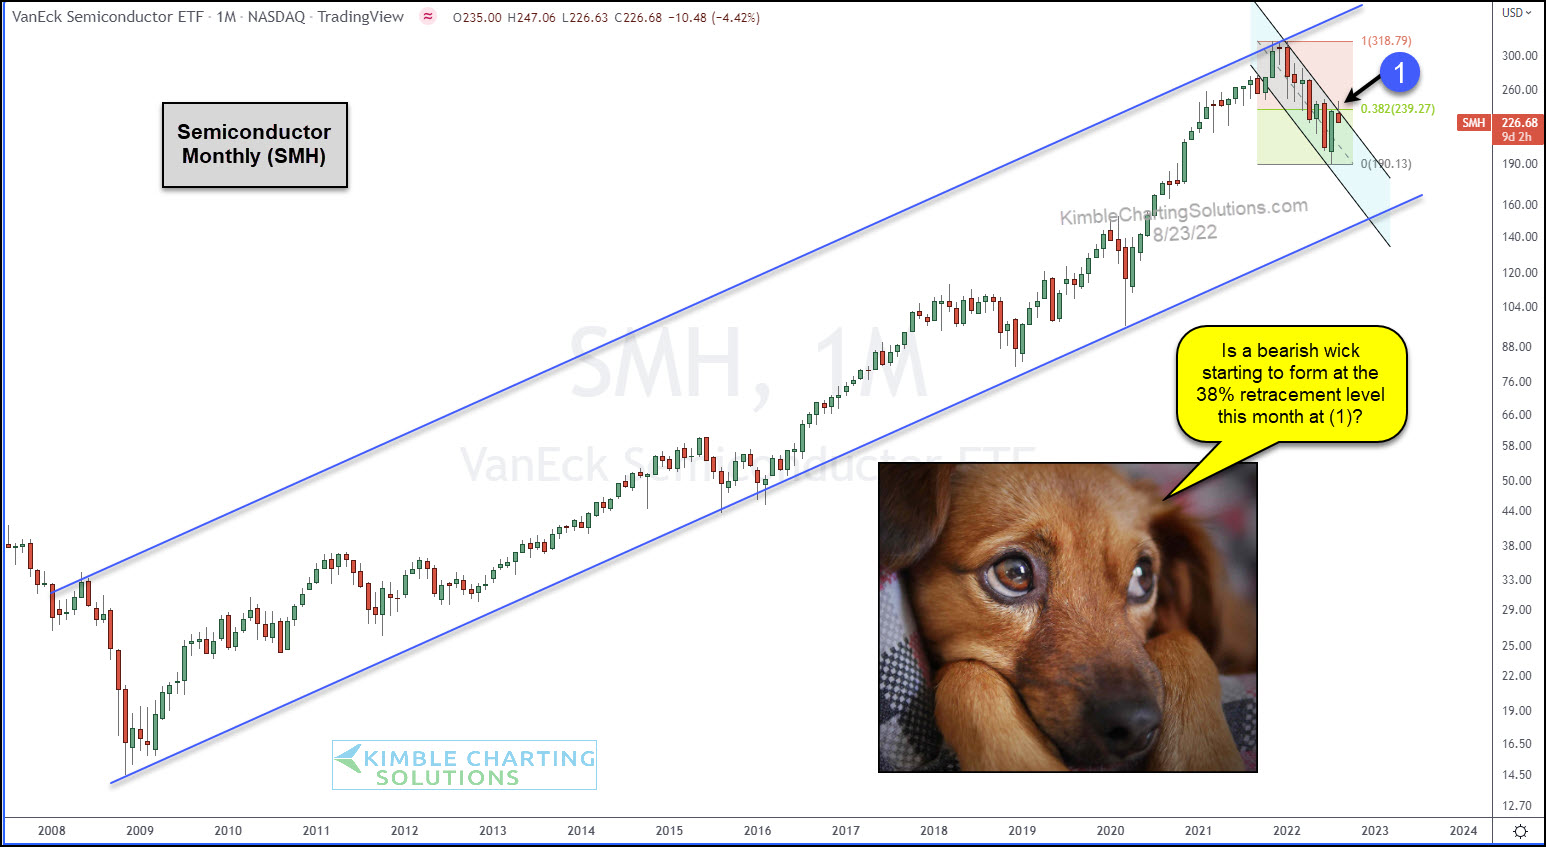
Today’s chart is a long-term “monthly” chart of SMH, the Semiconductor Sector ETF. This market leader has out-performed for the majority of the rally from the 2009 low. But it also peaked and lead the market lower at the end of 2021 and into 2022. So it is an important one to watch.
Currently, SMH is attempting to put in a bearish reversal for the August price candle. And this comes from none other than the 38.2% Fibonacci level. In my humble opinion, investors should keep an eye on how SMH finishes out the month.
Could leadership be creating a monthly bearish reversal at a key Fibonacci level this month?
(Click on image to enlarge)
More By This Author:
Are Crude Oil Prices Creating A Double Top Price Peak?
Semiconductors ETF (SMH) Trading Near Fibonacci Inflection Point
Is the CRB Commodity Index Peaking And Reversing Lower?


Comments
Log in or sign up to join the conversation.