
Luxury Slump Bankrupts Saks Fifth Avenue
“With the debt payment looming, time ran out.” That succinct summary ended a Wall Street Journal article titled: Saks Global Files for Bankruptcy, Undone by Debt and a Luxury Slump. A year ago, Saks Fifth Avenue’s parent company purchased its chief rival, Neiman Marcus, for $2.65 billion. The goal was to establish dominance and ultimately boost profits in the luxury retail sector. The rationale for the purchase was that the combined luxury retailers, which also included Bergdorf Goodman, would be more financially efficient as a single entity than as competing outlets.
The merger now appears to have been a last-ditch effort. The combined companies watched sales fall, making a $100 billion debt payment impossible to cover. Bankruptcy of the luxury brands is now the course of action. At a macro level, Saks’ collapse underscores a long-running trend that investors have been overlooking: department stores, both luxury and discount, have consistently lost pricing power, supplier leverage, and relevance. Despite billions invested in renovations, digital spin-offs, and marketing, cash flow was not enough to cover their debt. Assuming Saks emerges from Chapter 11, it will likely be a smaller, leaner, and less influential shell of its old self. This is yet another example of capital misdirecting its pursuit of yesterday’s trends, nostalgia, and optics, despite deteriorating economic conditions and changing consumer behaviors.
The picture below shows the iconic Saks Fifth Avenue store on Herald Square in New York, which opened in 1902.

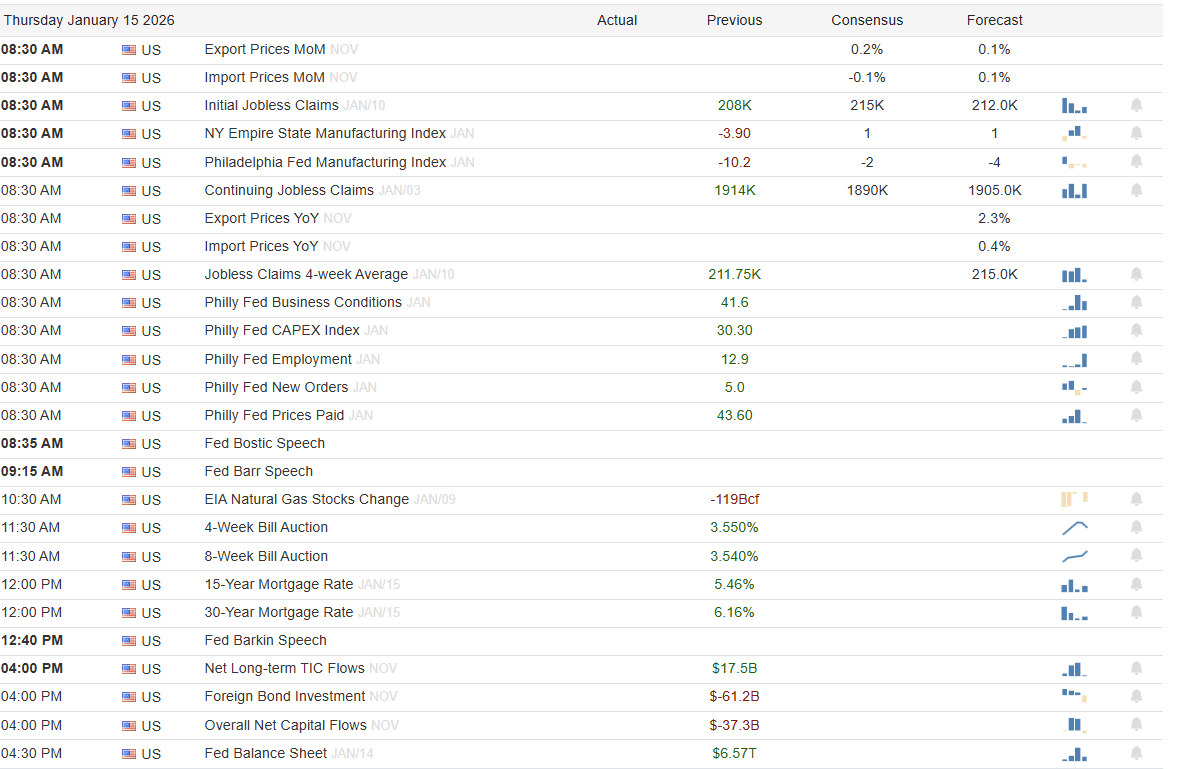
What To Watch Today
Earnings

Economy
(Click on image to enlarge)
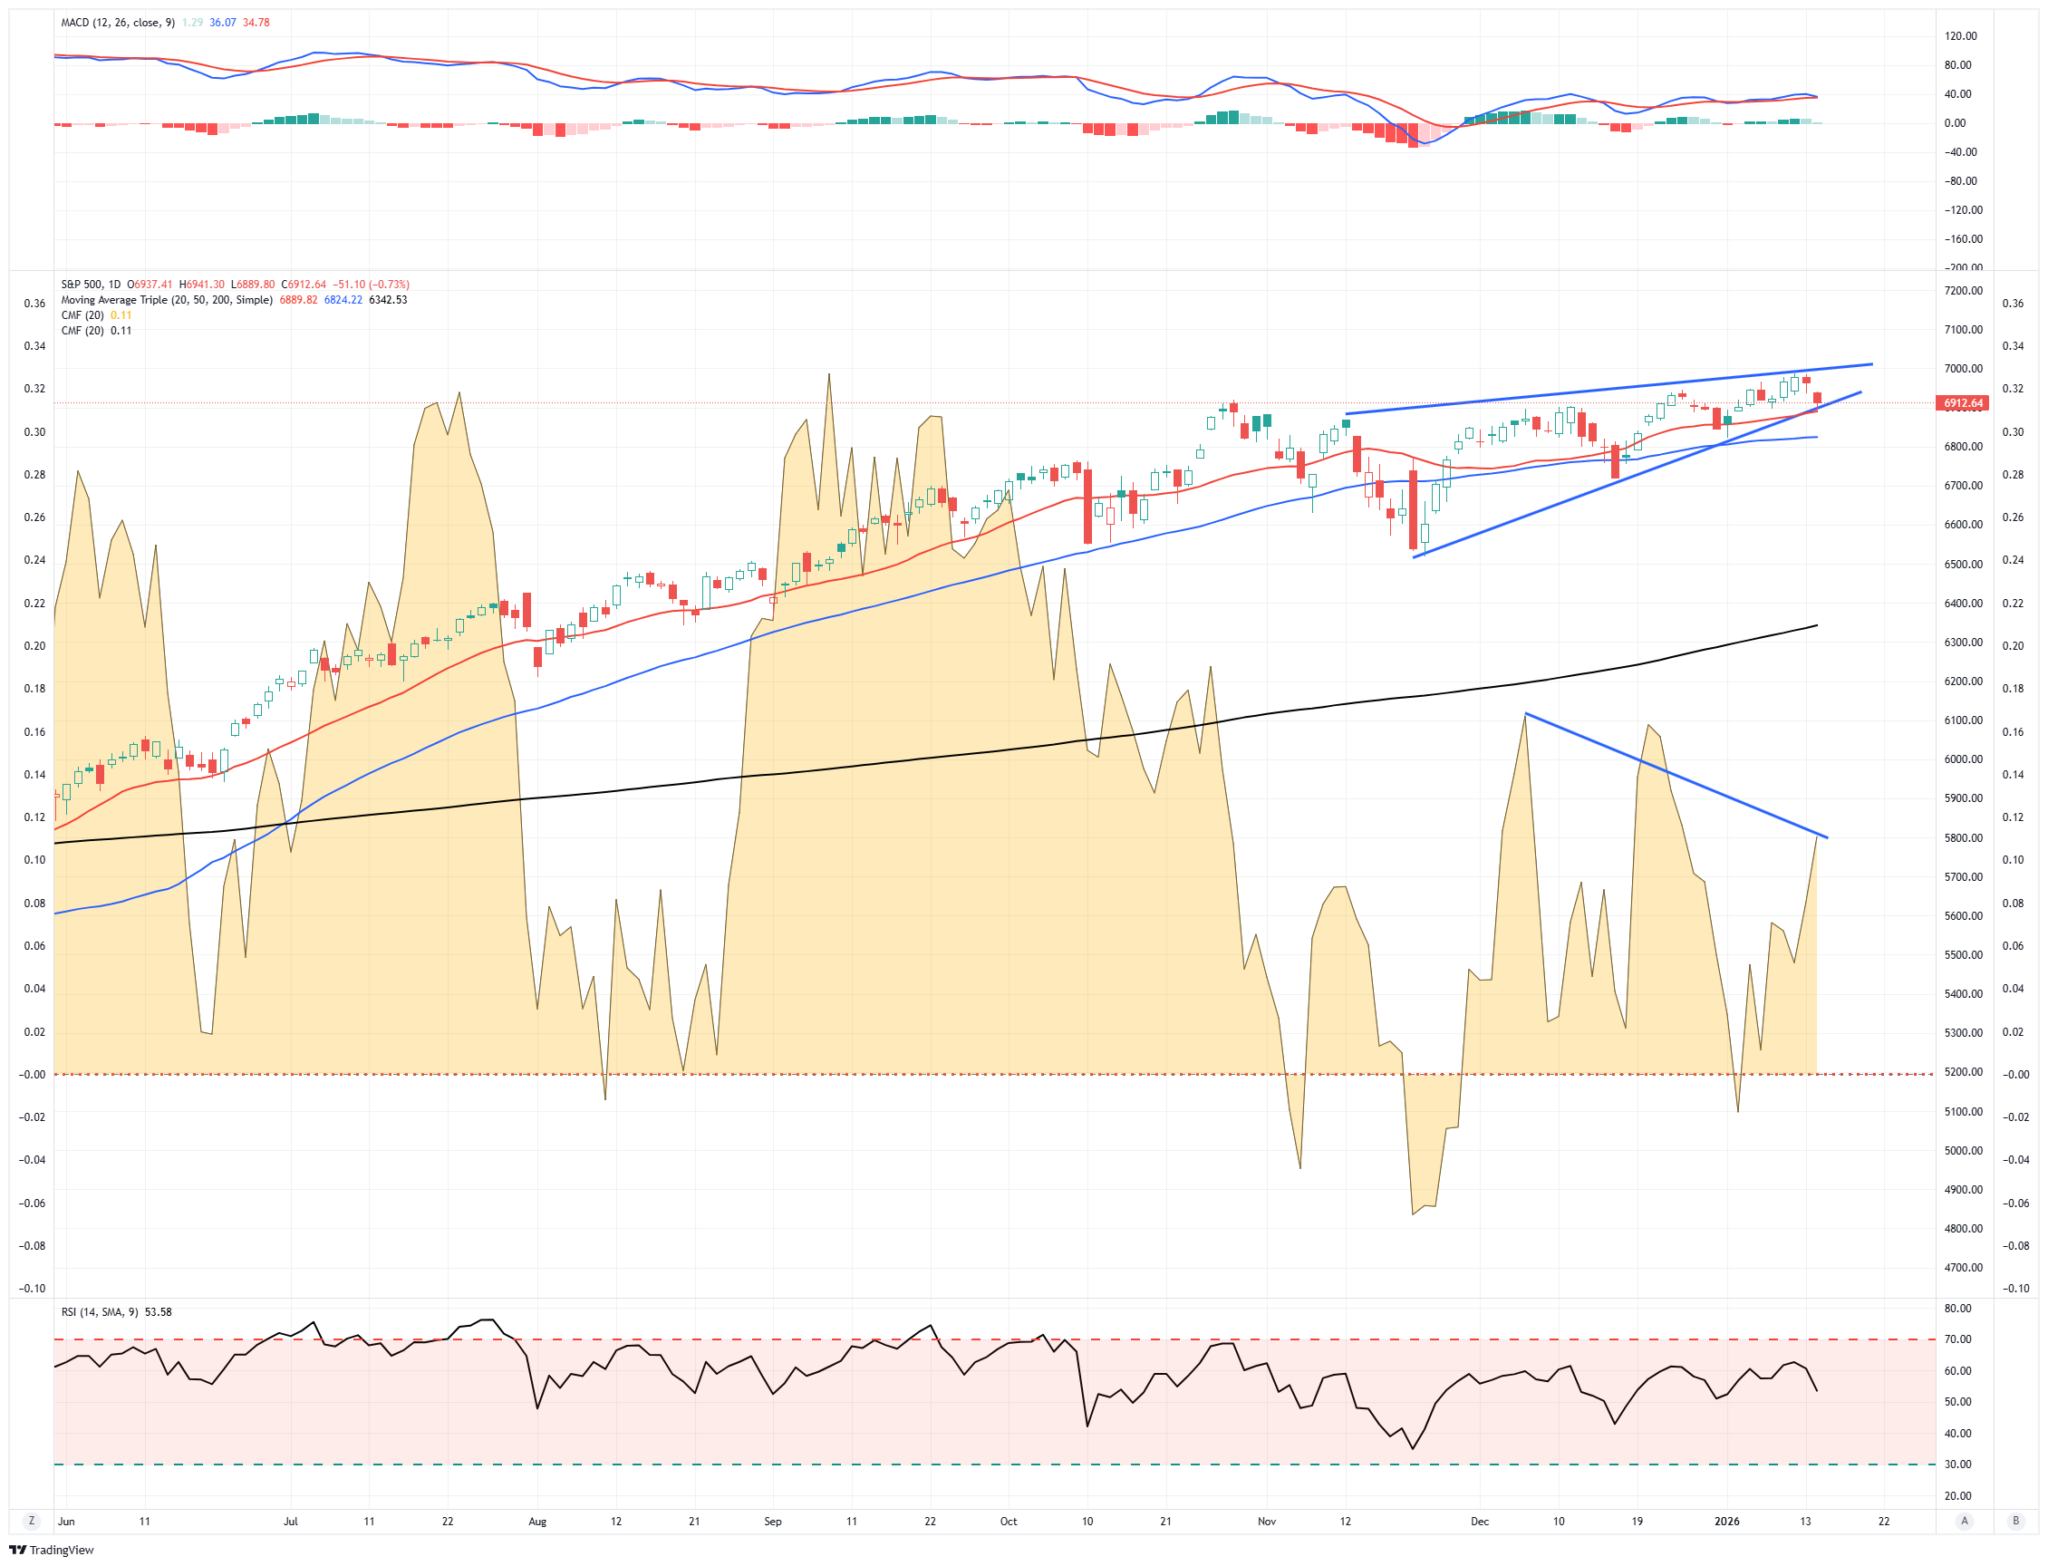
Market Trading Update
Yesterday, we discussed the “reflation narrative” driving analysts to rapidly increase earnings estimates. However, despite the exuberance, the markets are on the defensive this week, with both the S&P 500 and Nasdaq slipping from recent highs. Notably, price action has narrowed, and volume has weakened, with both relative strength and momentum indicators turning negative. That narrowing price action will lead to an eventual breakout to the upside or to the downside, leading to potential price targets of 7100 for the bulls, and 6800 for the bears.
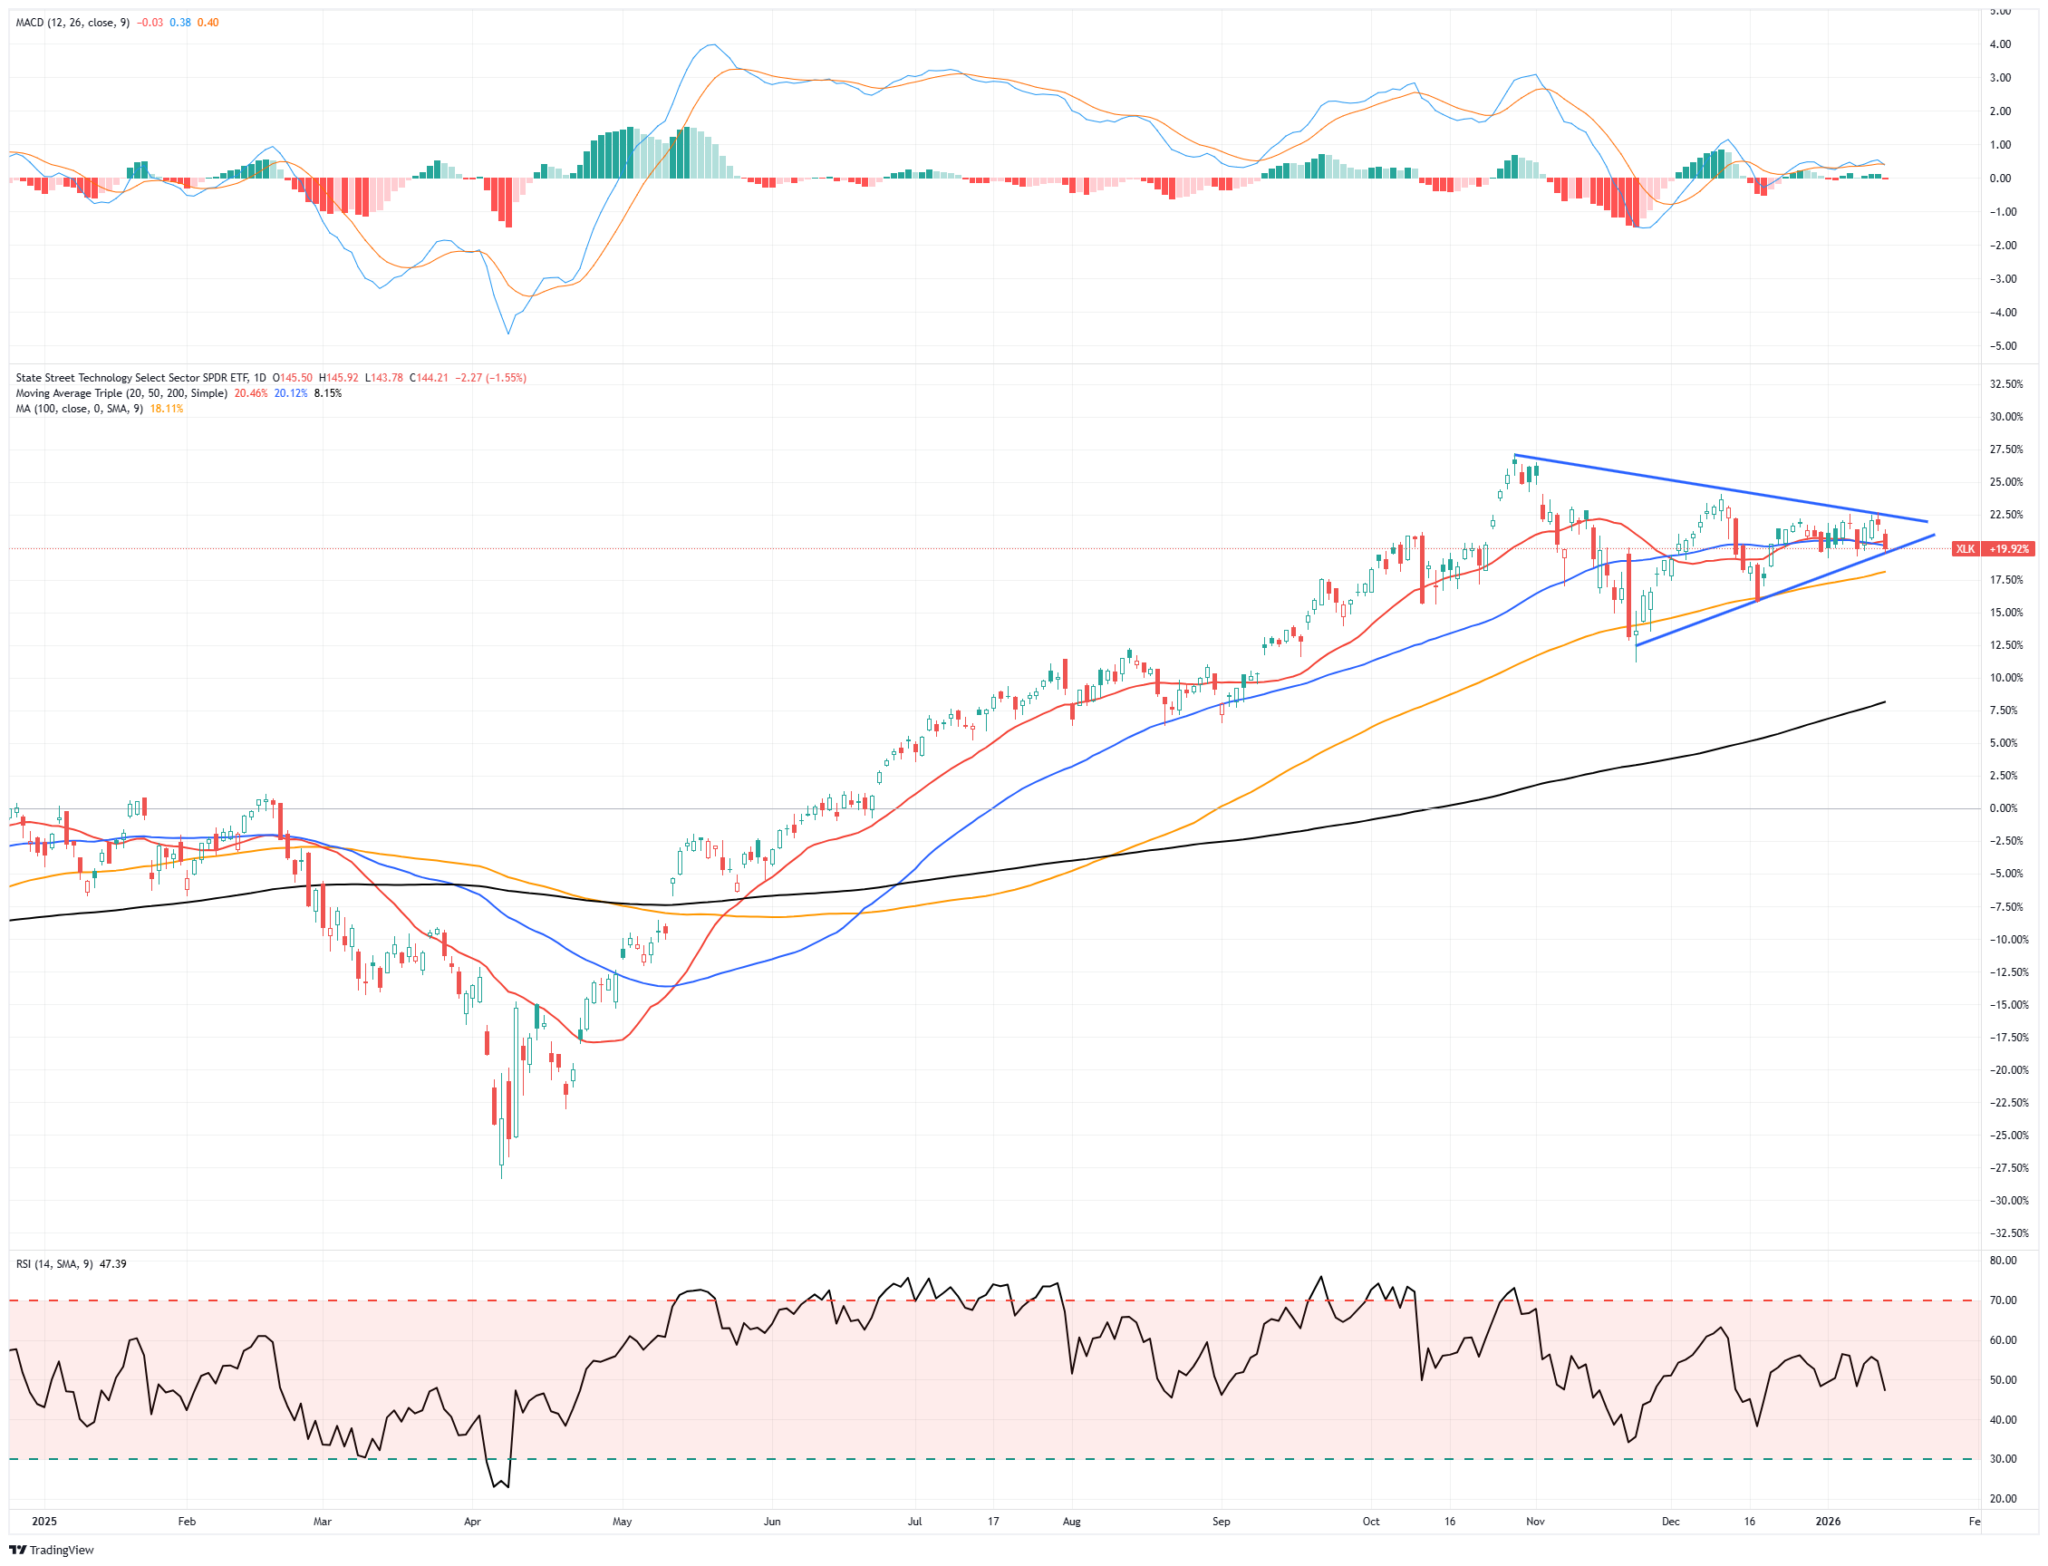
The weakness in the market is coming from two primary sectors: Finance and Technology. The financial sector opened earnings season and has disappointed. JPMorgan (JPM) reported adjusted earnings per share above expectations, but reported earnings came in below due to a surprise reserve tied to its Apple Card portfolio. That reserve dented profits and pulled the stock lower. Revenue growth was soft in several segments, and the market punished the stock despite solid headline numbers. Bank of America (BAC) topped profit estimates, helped by record net interest income and stronger trading revenue. Still, the stock fell as investors digested cautious forward guidance. Lastly, Wells Fargo (WFC) missed revenue expectations and issued a muted outlook for interest income. Net income rose year over year but fell short of consensus. These mixed results have dragged financials lower, increasing concerns about future earnings and the health of their balance sheets. We will see if that trend carries through to Goldman Sachs (GS), Morgan Stanley (MS), and BlackRock (BLK) this morning.
Technology stocks have also traded weakly as concerns over valuation, data center expenditures, and AI sentiment remain. Most of that weakness is likely due to managers repositioning ahead of earnings, which start next week. If earnings come in better than expected, which is likely the case, the recent selloff may be a good opportunity for traders to capitalize on short-term mispricing. Several large tech stocks are below their 50-day moving averages, and relative strength across the sector is weak. However, if earnings are strong, sentiment and momentum could quickly change.
(Click on image to enlarge)
Several risks continue to hang over this market.
- Earnings disappointments in key sectors could spark further selling.
- Market breadth remains weak, and leadership is narrow..
- Inflation data remains a concern if economic growth picks up.
- The Fed remains a wildcard. Any signs that rate cuts will be delayed could cause current positioning to unwind.
- Credit spreads are also widening in certain market segments, signaling potential stress beneath the surface.
- Geopolitical risks in the Middle East and domestic political uncertainty create a challenging risk-reward environment for investors.
In this type of setup, portfolio positioning is crucial. Investors should consider reducing exposure to sectors showing technical breakdowns, particularly areas with weakening momentum and deteriorating breadth. Raising cash or increasing allocation to short-duration Treasuries can provide flexibility. Avoid chasing lagging sectors until technical indicators confirm a shift in strength. Favor companies with strong balance sheets, steady free cash flow, and more predictable earnings. Trailing stops can help manage downside in individual positions.
As always, stay data-dependent. Let price action, earnings results, and macro signals—not narratives—drive decisions.
PPI And Retail Sales
Like CPI, PPI was slightly better than expected. The monthly PPI increased by 0.2%, in line with expectations. However, the core PPI was flat versus a consensus forecast of +0.2%. This PPI report, like recent CPI readings and Trueflation inflation readings (shown below), argues that the persistence of higher inflation, primarily due to tariffs, is finally easing. While it is too early to be certain, inflation may begin to decline in the coming months.
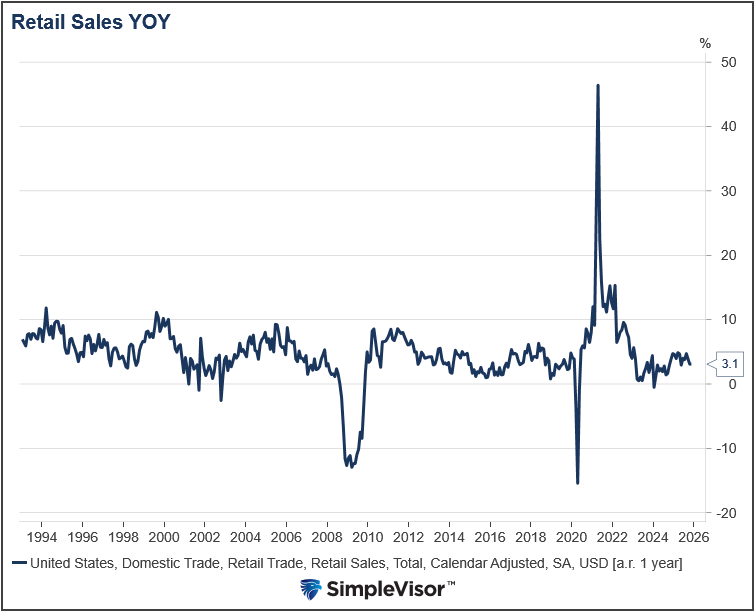
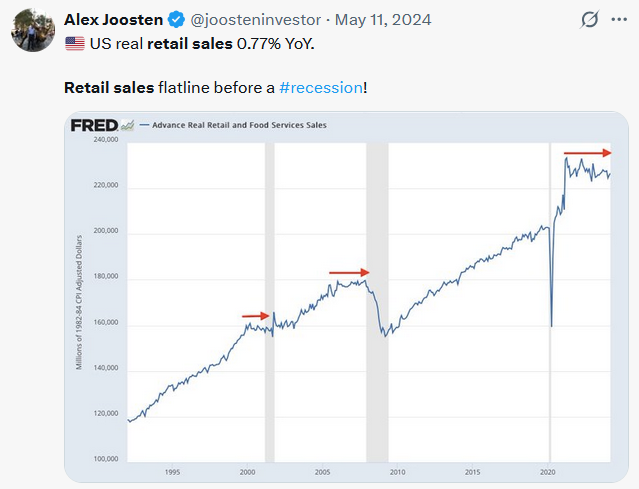
Retail Sales were slightly stronger than expected, growing at 0.6%. The data were for November, so while it captures Black Friday, it doesn’t include a substantial portion of the holiday buying season. The retail sales control group, which feeds into GDP, grew by 0.4%, in line with expectations. The second graph below shows that the year-over-year change in retail sales is 3.1%. While it is similar to pre-pandemic levels, we must remember the data is not inflation-adjusted. Thus, given that inflation is approximately 1-2% higher now than before the pandemic, real retail sales are decently weaker than the graph indicates. See today’s Tweet of the Day for more on this.

The Silver Surge: Micro Bubble Or Reasonable Valuation?
The narrative driving silver prices is twofold, stemming from its dual identity as both a precious and an industrial metal.
Silver is considered by precious metals investors to be gold with leverage, or high-beta gold. Simply put, these investors view silver, like gold, as a hedge against currency debasement and its perceived causes, such as rising deficits, unsustainable debt issuance, and loss of confidence in the dollar.
Unlike gold, silver is also promoted as a critical industrial metal, with demand recently increasing due to solar panels, electrification, AI data centers, and power grid expansion. There is some belief that demand is growing much more rapidly than supply, which is constrained and is likely to remain so for some time.
We have refuted the debasement argument, as we linked at the outset. While the supply-demand imbalance is promising, it doesn’t justify the surge in silver prices in our opinion.
Does the graph below resemble the left side of the bubble graphs we shared earlier, or does it accurately reflect fundamentals and the risk of a debased dollar?

Tweet of the Day
More By This Author:
The Silver Surge: Micro Bubble Or Reasonable Valuation?Transportation Stocks Are At Odds With Truck Sales
DOJ Investigates Powell: Implications For Fed Policy?
Disclaimer: Click here to read the full disclaimer.


