
Image Source: Unsplash
In Part 1: Learn to Love Company Debt: liquidity tells you if a company can pay its bills; leverage tells you how those bills are funded.
Today, we’ll put that playbook to work with four real-world names—two with low or no debt, and two using debt responsibly to compound. As you read, keep the Dividend Triangle in mind: revenue, earnings, dividend growth moving up together.
Quick recap from Part 1:
- Liquidity: Current, Quick, and Cash ratios show short-term flexibility.
- Leverage: Debt-to-Assets, Debt-to-Equity, and Financial Debt-to-EBITDA show long-term structure.
- Rule of thumb: Compare to peers, follow trends, and overlay the Dividend Triangle.
Franco-Nevada (FNV.TO)
- Yield: 0.95%
- Market Cap: $43B
- Total long-term debt: $0
(Click on image to enlarge)
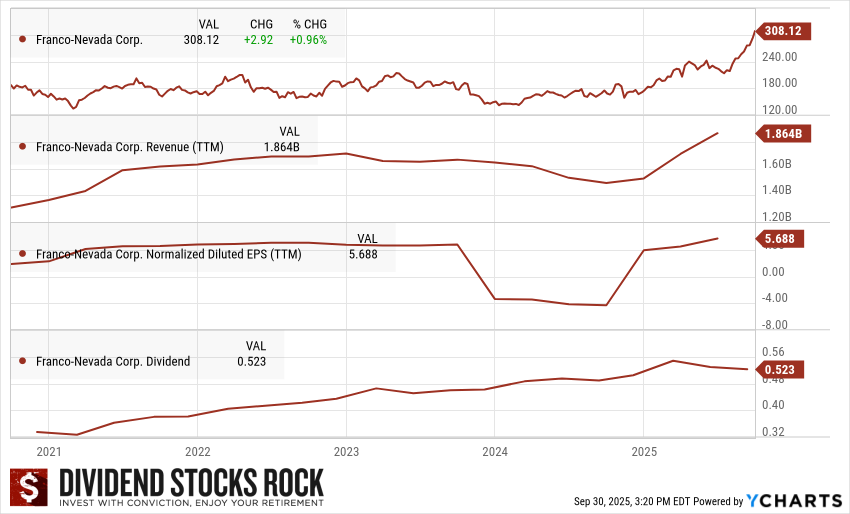
Franco-Nevada (FNV.TO) 5-Year Dividend Triangle chart.
Franco-Nevada operates as a royalty and streaming company focused on gold, precious metals, and energy assets.
Unlike traditional mining companies, it does not engage in operations but instead collects royalties and streaming revenues from a diversified portfolio of projects. This business model allows it to benefit from rising commodity prices while avoiding operational risks.
The company holds significant land assets and partners with mining operators to secure long-term revenue streams.
Why it works: Diversified counterparties, long-lived contracts, structurally high margins.
What to watch: New deal pipeline, commodity sensitivity, partner execution.
What this means for your dividend: With little balance-sheet pressure and steady cash inflows, management has room to raise the dividend through cycles and still keep dry powder for attractive new streams.
Jack Henry & Associates (JKHY)
- Yield: 1.30%
- Market Cap: $13B
- Total long-term debt: $80M
(Click on image to enlarge)
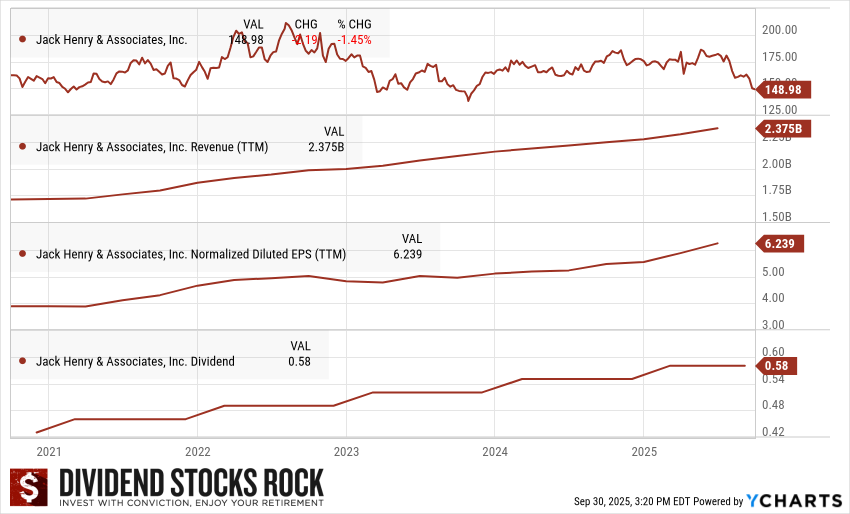
Jack Henry (JKHY) 5-Year Dividend Triangle chart.
Jack Henry is a top-tier fintech provider to the banking sector, operating through three key segments: core processing, payments, and complementary services (digital banking, fraud, treasury).
It serves roughly 80% of U.S. credit unions and community banks. Its business model generates strong recurring revenue from SaaS-like solutions and transaction fees. The company takes care of all the technology behind banking operations. You can imagine how sticky this business is!
Why it works: Mission-critical systems, high switching costs, dependable fee economics.
What to watch: Digital banking wins, retention, and operating margin discipline.
What this means for your dividend: Low leverage plus recurring revenue support consistent payout increases without relying on capital markets.
Debt, Done Right (Offense + Discipline)
Dollarama (DOL.TO) — Canada
- Yield: 0.20%
- Market Cap: $52B
- Total long-term debt: $4.15B
(Click on image to enlarge)
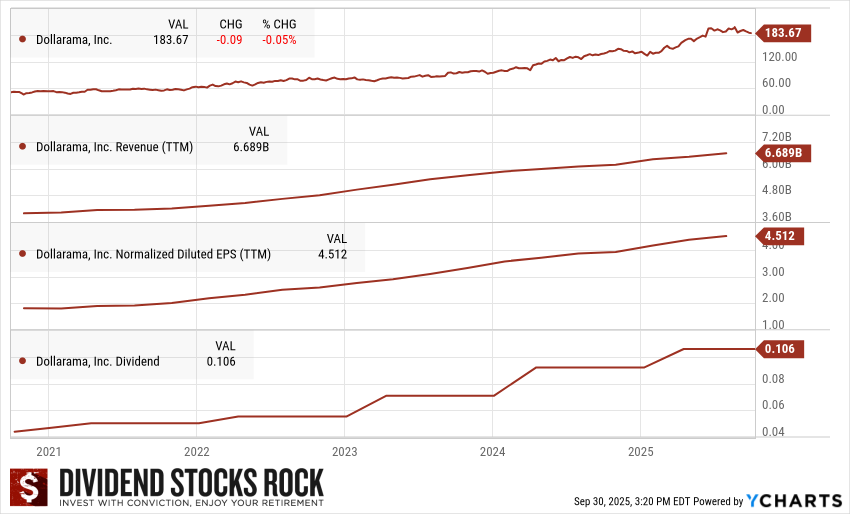
Dollarama (DOL.TO) 5-Year Dividend Triangle chart.
Dollarama is Canada’s largest dollar store chain, offering low-cost general merchandise and consumables. With ~1,600 stores across Canada and a 60% stake in Dollarcity (active in Colombia, El Salvador, Guatemala, and Peru), DOL is proving that its disciplined, high-efficiency business model works at scale—and abroad.
Dollarama thrives in uncertain economic climates by leaning into price sensitivity and convenience. It’s also growing consistently by adding stores and raising price caps (recently to $5) while improving margins through private-label product expansion and tight supply chain control. Even in a rising cost environment, its low-cost, high-turnover model delivers attractive returns.
Why it works: High store productivity, rapid inventory turns, pricing power via multi-price points.
What to watch: Same-store sales, gross margin discipline, lease obligations, maturity ladder.
What this means for your dividend: Steady free cash flow, disciplined leverage, and visible growth runway support continued dividend increases while leaving flexibility for store growth and buybacks.
Accenture (ACN) — U.S.
- Yield: 1.95%
- Market Cap: $188B
- Total long-term debt: $5B
(Click on image to enlarge)
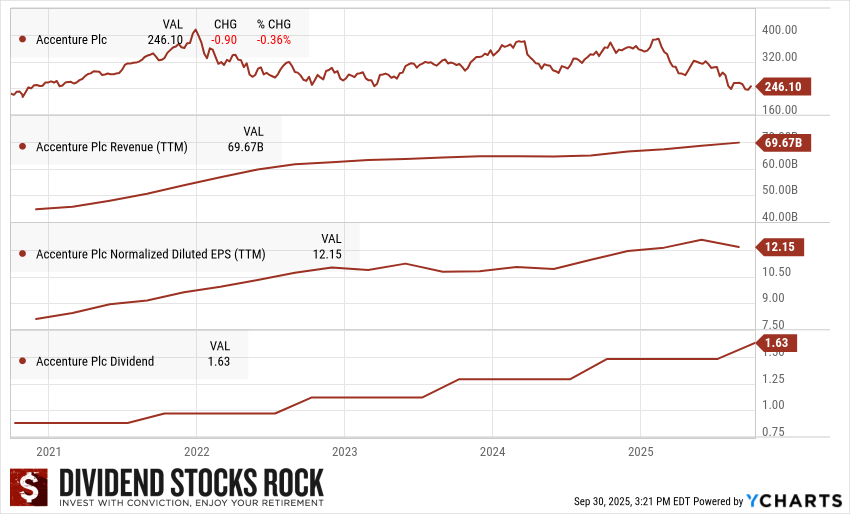
Accenture (ACN) 5-Year Dividend Triangle chart.
Accenture is the leader in its market, as three-quarters of Fortune 500 firms work with it. Such relationships with its clients make it hard for their customers to switch to a competitor.
ACN is a real cash cow that generates continuous free cash flow, which ensures a sustainable dividend growth policy. ACN’s business should thrive along with the industry, fueled by AI in general. We see ACN as a clear frontrunner in the race to establish leadership in AI and believe its balance sheet will enable it to continue investing both internally and externally. We think the company remains a long-term share gainer, with a differentiated growth engine (digital, security, and cloud) squarely situated in the middle of current (and future) customer priorities.
We see ACN as a high-quality name that holds up well in a mixed macro environment due to its diverse client relationships, strong balance sheet, and track record of above-average EPS growth.
Why it works: Diversified industries, repeat revenue, and a cash-rich model that absorbs shocks.
What to watch: Bookings momentum, utilization, integration of acquisitions, working capital.
What this means for your dividend: Conservative leverage and robust cash generation support ongoing dividend hikes while leaving flexibility for strategic investments.
How to Use These Examples at Home
- Match model to balance sheet. Asset-light franchises can run ultra-lean; scaled retailers can use measured debt to expand profitably.
- Prefer predictable cash. Recurring or high-turnover cash flows make any debt safer.
- Follow trends, not snapshots. Flat-to-down Debt/EBITDA with rising earnings signals improving safety.
- Recheck liquidity in storms. Healthy Current and Quick ratios reduce the odds of emergency equity raises or dividend cuts.
- Keep the Dividend Triangle front and center. When revenue, EPS, and dividends climb together while leverage stays contained, you likely own a compounding machine.
More By This Author:
Confused About Stock Price Movement?
Pumping Steady Cash Flow Into Dividends
The Year So Far: Nothing Is Like It Seems


Comments
Log in or sign up to join the conversation.