
The academic research, including the 2023 studies “Lottery Preference and Anomalies” and “Do the Rich Gamble in the Stock Market? Low Risk Anomalies and Wealthy Households,” the 2022 study “Lottery Demand and the Asset Growth Anomaly,” and the 2014 study “Do Investors Overpay for Stocks with Lottery-like Payoffs? An Examination of the Returns on OTC Stocks,” has found that there are investors who have a “taste,” or preference, for lottery-like investments—those that exhibit positive skewness and excess kurtosis (fat tails). This leads them to irrationally (from a traditional finance perspective) invest in high-volatility stocks (which have lottery-like distributions), driving their prices higher, and resulting in poor returns.
Biotech and pharmaceutical companies fit the profile of what can be called “big story” stocks, companies with the potential to achieve lottery-like returns. With that in mind, Clark Dean of Verdad’s research team examined the performance of the biotech and pharmaceutical stocks over 1996-2023 in his paper “The Biotech Boneyard.”
Dean began by separating the biotech and pharma stocks into those with over $10 million of revenue and those with under $10 million of revenue (which he labeled as “no-revenue” companies). He found that while the companies with revenue returned 10.4% since 1996 (outperforming the 9.5% annualized return of both Vanguard’s 500 Index Fund, VFINX, and its Total Stock Market Index Fund, VTSMX), companies with no revenue compounded at -9.3%—a performance gap of 19.7 percentage points.
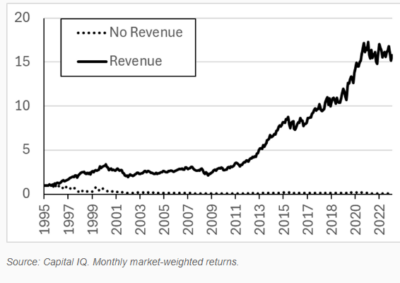
The results are hypothetical results and are NOT an indicator of future results and do NOT represent returns that any investor actually attained. Indexes are unmanaged and do not reflect management or trading fees, and one cannot invest directly in an index.
That divergence in performance was equally eye-popping over the past 10 years:
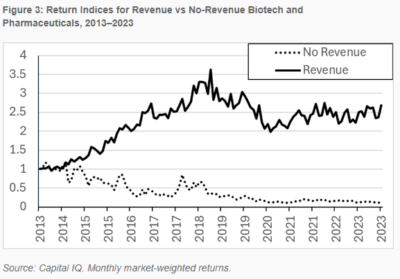
The results are hypothetical results and are NOT an indicator of future results and do NOT represent returns that any investor actually attained. Indexes are unmanaged and do not reflect management or trading fees, and one cannot invest directly in an index
Given the divergence in performance, Dean set out to determine if he could identify any “diamonds in the rough”—the future winners who had not begun to generate at least $10 million in revenue. With that objective, Dean analyzed the performance of the no-revenue companies with over $50 million of market cap to see if any factors could be used to pick out the future outperformers. He focused on spending (cash burn rate plus capital expenditures) as a proxy for scale, and cash balances as a proxy for quality. In terms of total enterprise value, he used total debt and market cap. He found that only the lowest-valuation quintile produced (barely) positive returns.
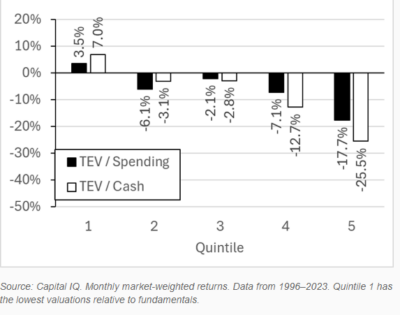
The results are hypothetical results and are NOT an indicator of future results and do NOT represent returns that any investor actually attained. Indexes are unmanaged and do not reflect management or trading fees, and one cannot invest directly in an index.
Dean found that both higher cash and higher spending are good. The finding on spending conflicts with economic theory and empirical research for stocks in general. Using current asset growth as a proxy for expected investment, valuation theory suggests that firms with high asset growth/high investment growth should be expected to underperform the market. The empirical research findings are consistent with valuation theory, demonstrating that companies with high rates of growth of investment/assets tend to underperform. Given the conflict, I asked Dean his thoughts on that finding.
He responded: “I agree that the spending is a little weird, but when we developed the metric, we were thinking that spending is a good proxy for successfully building scale. You have to convince investors to give you money in order to invest, and you have to have promising research to fund in order to invest. In that sense it seems intuitive that for zero-revenue biotechs especially, the more spending/investing and cash on hand, the better.” Dean then examined how years of cash remaining (measured as cash/total annual spending) related to returns. According to EY, 29% of biotechs had less than one year of cash available.
Dean wondered whether companies with more time to succeed did better. The chart below shows the return by years of cash available. The companies in quintile 1 averaged 4 months of cash, the companies in quintile 2 averaged just under a year, and the companies in quintiles 3, 4 and 5 averaged 1.5, 2.4, and 4.9 years, respectively. Taken together with the results of the prior paragraph, this qualifies the finding that while higher spending is good, it should not be excessive relative to cash remaining. Unfortunately, he found that while companies with more runway to succeed fared better than the larger universe’s compounded annual return of -9.3%, they still produced negative returns (-3.2%).

The results are hypothetical results and are NOT an indicator of future results and do NOT represent returns that any investor actually attained. Indexes are unmanaged and do not reflect management or trading fees, and one cannot invest directly in an index.
The final factor Dean examined was momentum, using the trailing three-month return. While momentum is an explanatory factor in returns overall (past returns exhibit at least a weak predictive tendency for future returns), in this case, the opposite was true. The trailing returns were a terrible indicator of positive returns: High returns were followed by significant underperformance, and the stronger the recent performance, the worse the results. On the other hand, no-revenue companies with the lowest previous returns (quintile 1) showed a tendency to mean revert, with a 5.5% forward return.
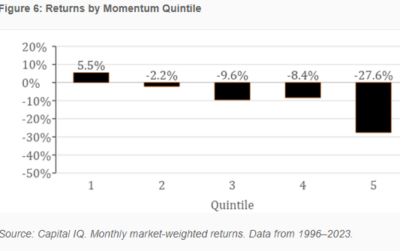
The results are hypothetical results and are NOT an indicator of future results and do NOT represent returns that any investor actually attained. Indexes are unmanaged and do not reflect management or trading fees, and one cannot invest directly in an index.
While Dean’s findings are inconsistent with the overall research on momentum, they are consistent with the findings from the 2022 study “Lottery Demand and the Asset Growth Anomaly.” The authors used the maximum daily return over the past month (MAX) to measure investors’ lottery preference because an extreme past return represents a form of lottery-like payoff. They found a negative relationship between the maximum daily return over the past month and expected stock returns.
Investor Takeaways
Dean’s findings, supported by the empirical research findings we covered, demonstrate that making a bet on biotech/pharma firms that have not yet achieved significant revenue is the equivalent of buying a lottery ticket—with the same poor risk/return relationship. Dean showed that while achieving significant revenue can be a savior for biotech firms, “history has shown us that making this revenue bet early does not pay off. In our data, under 2% of these companies get to revenue within a year, and even then, their returns are worse, not better, than the rest of the companies.”
Fund families with investment strategies based on academic research, such as Alpha Architect, AQR, Bridgeway, and Dimensional Fund Advisors, have long been excluded from their eligible universe stocks with lottery characteristics.
For investors, one takeaway is to avoid getting caught up in the hype of “story stocks” that come with the “promise” of lottery-like returns should they succeed. A second takeaway is that an efficient way to improve the expected performance of an equity strategy is to systematically exclude firms (especially small firms) with high asset growth and extreme past returns, especially if they have low profitability.
More By This Author:
Financial Literacy In The US…Doesn’t Look Great!
Outperforming Cap- (Value-) Weighted and Equal-Weighted Portfolios
The Financial Distress Puzzle

Comments
Log in or sign up to join the conversation.