
Large Cap Growth Underperforms Everything
The past year has been a rough road for equities, but growth in particular has certainly seen its fair share of underperformance. The past month especially has been a notable microcosm of that underperformance. As we approach the one-year mark of the last all-time high in growth-oriented indices like the Nasdaq or S&P 500 Growth index, large-cap growth’s relative strength has broken down versus equities broadly, as well as growth and value across various market cap ranges.
As shown below, S&P 500 Growth relative to the S&P 500 steadily moved higher (upwards trending lines indicate S&P 500 growth outperformance) throughout the post-Global Financial Crisis era and absolutely took off in the early stages of the pandemic. After peaking in November of last year, the relative performance of growth has been on the downswing and erasing most of its earlier pandemic outperformance. In fact, following the historic weakness of mega caps on earnings that has continued into this week, the relative strength is now at the lowest level since the end of February 2020.

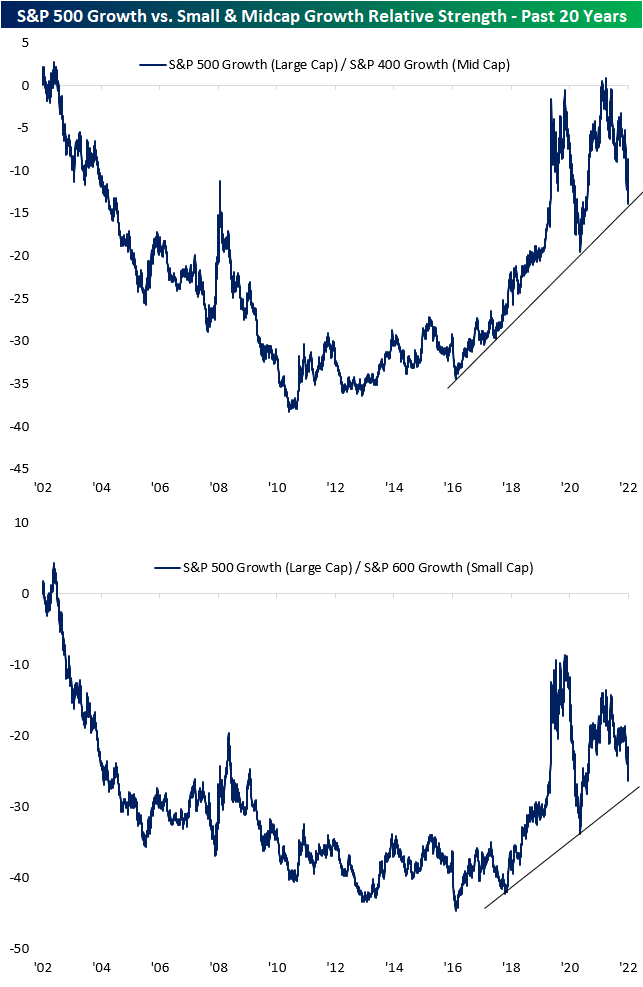
Large-cap growth has not only underperformed other large caps, but it has also dramatically underperformed its mid and small-cap peers. From the post-Dot Com Bubble years through the Global Financial Crisis period, large-cap growth serially underperformed growth stocks of both the mid and small-cap varieties. The past decade, however, erased much of that underperformance. In fact, the 20-year relative strength line of S&P 500 growth versus S&P 400 growth actually turned positive briefly earlier this year in February. In other words, after almost two decades the performance of large-cap (S&P 500) and mid-cap (S&P 400) growth was finally near equal. Since then, the relative strength line has pivoted sharply lower and is now testing the uptrend line that has been in place since 2016.
Relative to small-cap growth, large-cap growth was much weaker in the first half of the 2010s and didn’t really begin to turn higher until the past five years. With that said, it also peaked far earlier (September 2020) than the relative strength versus mid-cap growth and is not quite testing its multiyear uptrend line yet.
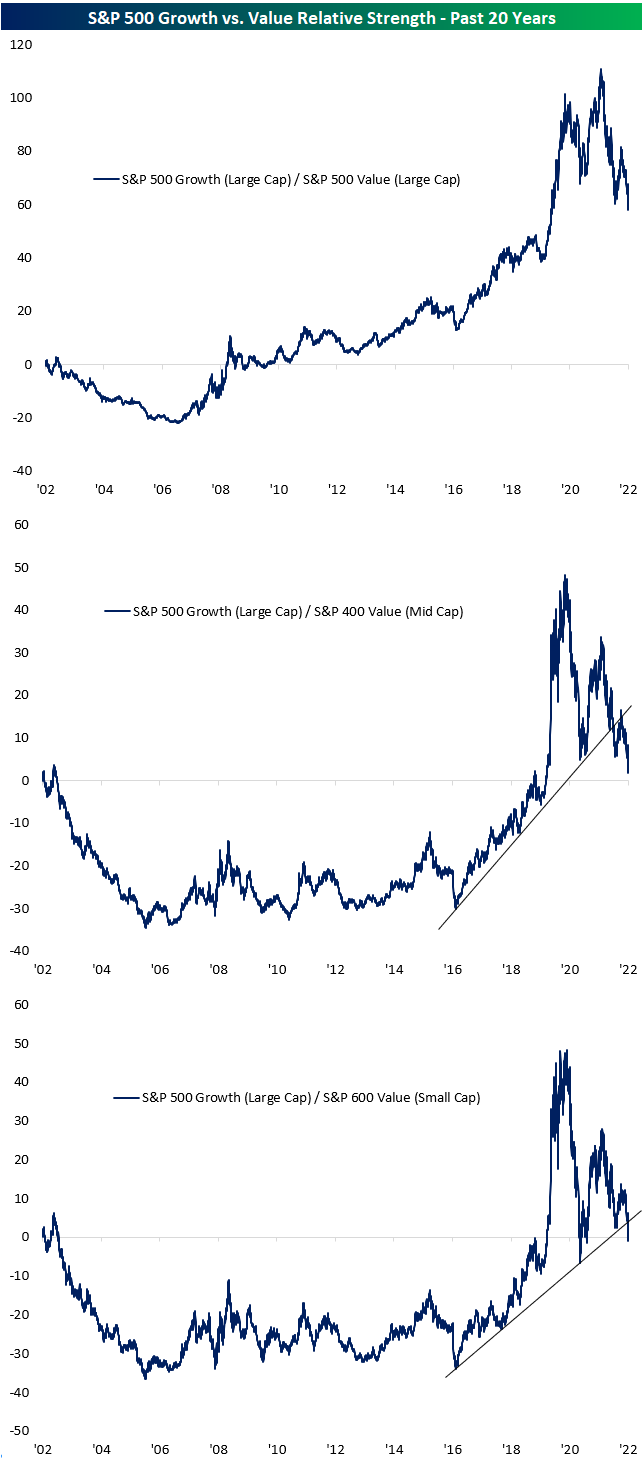
Where the more dramatic underperformance of large-cap growth has been is relative to value stocks. As shown in the first chart below, relative to large-cap value, large-cap growth generally remains in its longer-term uptrend although most post-pandemic outperformance has been erased. Moving down the market cap chain increasingly worsens that picture through. The relative strength line of S&P 500 growth versus S&P 400 value recently hit a new low for the post-pandemic period, nearing the flatline in the process. In other words, large-cap growth has almost erased all of its outperformance versus mid-cap value, not only since the start of the pandemic but over the past 20 years. As for small caps, that outperformance is now gone entirely gone as the relative strength line now registers negative readings. Both versus mid and small-cap value, large-cap growth has definitively broken its multi-year uptrends that had been in place since late 2016.
More By This Author:
Best and Worst Performing Stocks Since Rate Hikes Began
Wild Monthly Moves
Even The Yen Is Up
Click here to learn more about Bespoke’s premium stock market research service.
See Disclaimer ...
more

