
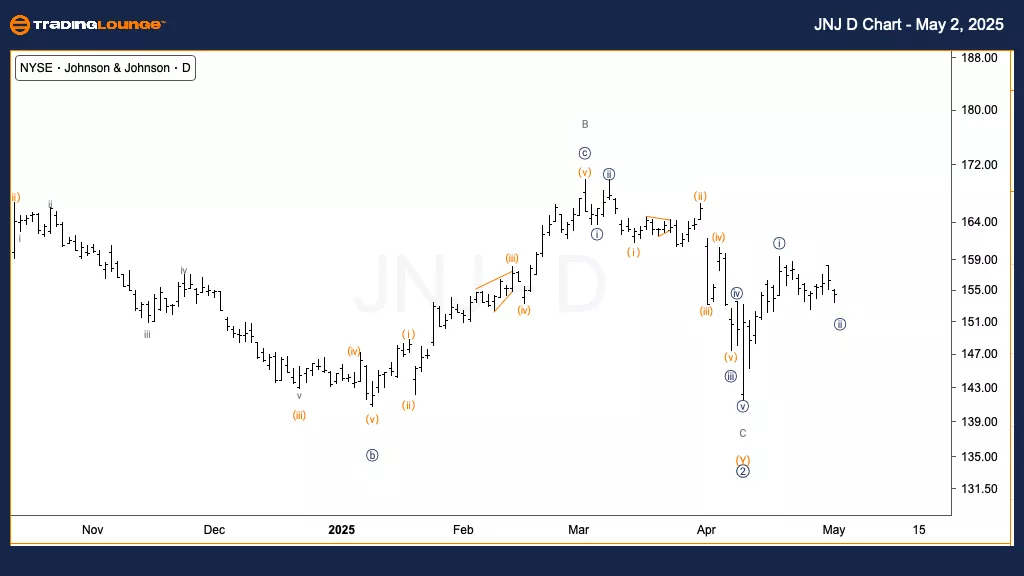
Johnson & Johnson (JNJ) Daily Chart
JNJ Elliott Wave Technical Analysis
FUNCTION: Trend
MODE: Impulsive
STRUCTURE: Motive
POSITION: Wave {i} of 1
DIRECTION: Upside in wave 1
Details:
We are tracking a potential major bottom forming in Primary wave 2. A clear five-wave move into wave {i} suggests the early stages of an upside trend resumption.
(Click on image to enlarge)
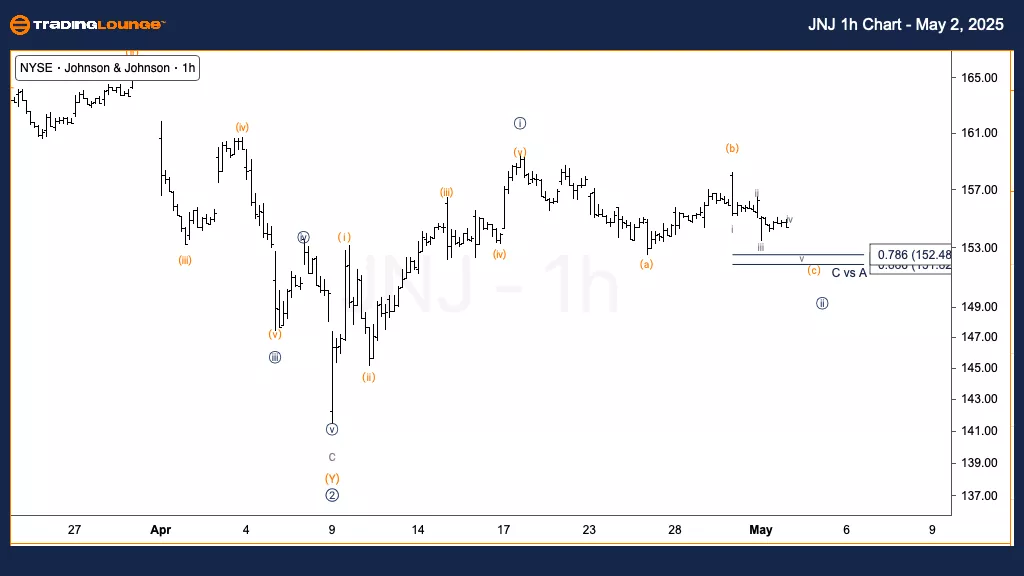
Johnson & Johnson (JNJ) 1-Hour Chart
JNJ Elliott Wave Technical Analysis
FUNCTION: Trend
MODE: Impulsive
STRUCTURE: Motive
POSITION: Wave (c) of {ii}
DIRECTION: Bottom in wave (c)
Details:
We expect a little more downside to complete wave (c), which should then pivot higher. This upward move could either mark the beginning of Minute wave {iii} if the Primary wave 2 bottom is confirmed, or it could be the start of wave {c} of another degree.
(Click on image to enlarge)
JNJ Elliott Wave Summary:
This analysis of Johnson & Johnson (JNJ) examines both the daily and 1-hour timeframes using Elliott Wave Theory to outline current market trends and predict future price directions.
Daily Chart:
We are monitoring the possible completion of a major corrective Primary wave 2. A clear five-wave impulsive sequence in wave {i} indicates an early trend reversal, pointing towards the beginning of a new bullish cycle.
1-Hour Chart:
On the lower time frame, wave {ii} correction appears nearly complete, with wave (c) needing a final push lower. A confirmed bottom could initiate a stronger bullish move into wave {iii}.
More By This Author:
Energy Select Sector ETF XLE - Elliott Wave Technical Analysis
Trading Strategies For S&P 500, Nasdaq 100, DAX 40, FTSE 100 & ASX 200
Qualcomm Inc. - Elliott Wave Technical Analysis


Comments
Log in or sign up to join the conversation.