
Industry Performance And CPI
Tomorrow’s release of March CPI is expected to show headline inflation cooling to 5.1% on a y/y basis from 6.0% in February. In the table below, we break down the average performance (in basis points) of each of the 24 industry groups in the S&P 500 on days of CPI releases since 2000 based on how the headline reading came in relative to expectations. There have been some notable shifts in reactions among groups to CPI reports in the pre and post-COVID (February 2020) periods. For example, in the pre-COVID period, the three best-performing industry groups on days when CPI was stronger than expected were Real Estate, Banks, and Semis. In the post-COVID period, though, these three industry groups have been among the market’s worst performers on CPI beats with all three averaging one-day declines of at least 69 bps compared to the S&P 500’s average decline of 62 bps. Interestingly, the disparity is a lot less apparent when we compare pre and post-COVID performance on days when CPI is weaker than expected.
(Click on image to enlarge)

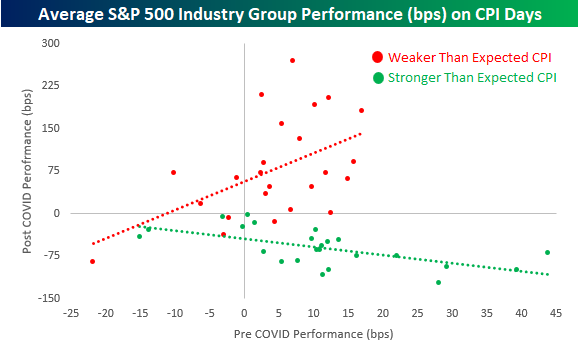
To further illustrate this shift and how it has been much more notable on days when the CPI is stronger than expected, the scatter chart below compares industry group performance on CPI days in the pre and post-COVID periods when the headline reading comes in better and worse than expected. Starting with weaker-than-expected CPI days (red dots and red trendline), the trendline is positively sloped as groups that tended to perform best on weaker-than-expected CPI days are generally still performing the best while the industry groups that lagged on weaker-than-expected CPI days still tend to lag in the post-COVID period. The performance dynamic on stronger-than-expected CPI days (green dots and trendline), however, is the complete opposite as the trendline is negatively sloped indicating that the best-performing groups pre-COVID have tended to be the weakest in the post-COVID period and vice versa.
More By This Author:
Inflation Concerns Continue To Ease
Small Business Outlook Cratering
Full-Time Septuagenarian Workers Put In The Most Hours
Disclaimer: Bespoke Investment Group, LLC believes all information contained in this report to be accurate, but we do not guarantee its accuracy. None of the information in this report or any ...
more

