How To Value A Stock With The Benjamin Graham Formula
With the extremely popular free Ben Graham stock spreadsheet I offer, the stock valuation method deserves a closer look.
Original Benjamin Graham Formula
The original formula from Security Analysis is
![]()
where V is the intrinsic value, EPS is the trailing 12 month EPS, 8.5 is the PE ratio of a stock with 0% growth and g being the growth rate for the next 7-10 years.
However, this formula was later revised as Graham included a required rate of return.
![]()
The formula is essentially the same except the number 4.4 is what Graham determined to be his minimum required rate of return. At the time of around 1962 when Graham was publicizing his works, the risk free interest rate was 4.4% but to adjust to the present, we divide this number by today’s AAA corporate bond rate, represented by Y in the formula above.
(credit to wikipedia for the formula images)
Adjust Earnings Per Share in the Graham Formula
But intrinsic value shouldn’t be calculated based on a single 12 month period which is why I have the EPS automatically adjusted to a normalized number ignoring one time huge or depressed earnings based on 5 year or 10 year history depending on the company you are looking at.
EPS is never really a good number on its own as it is highly prone to manipulation with modern accounting methods. Another reason why you have to always normalize EPS is because management will never understate earnings on purpose. While companies may follow accounting procedures which inflates earnings, they will never go out of their way to make it lower than it is.
Another variation of the formula will use the projected EPS but unless it is a pure growth stock with exponential growth like characteristics, the stock value will become absurdly high.
Adjust Growth Rate Per Today’s Environment
The drawback of the Benjamin Graham formula is that growth is a big element of the overall valuation.
You can change 8.5 to whatever you feel is the correct PE for a no growth company. Depending on your conservativeness, anything between 7 and 8.5 should be fine.
For the actual growth rate, if convenience is important, you could just use the analyst 5yr predictions from Yahoo or other sites, but for most value stocks that I search for, predictability is important so a regression of the historical EPS to project the following year is a method I like to use.
The “2 x G” however, is quite aggressive. So I’ve recently reduced the multiplier to 1 instead of 2. You’ll see why in the examples below.
Corporate Bond Rate
I currently have the Old School Value analyzer and Grader set up to use the 20 year A corporate rate which is just above 6%. This provides a slightly more conservative intrinsic value than the 20 year AAA or AA.
If you look at the current settings, it is set up for 3.56%.
Final Adjusted Benjamin Graham Formula
So by making the adjustments, the new formula is now

Bejamin Graham Formula Adjusted Version
Testing the Adjusted Graham Formula
Let’s test this across several different companies and industries.
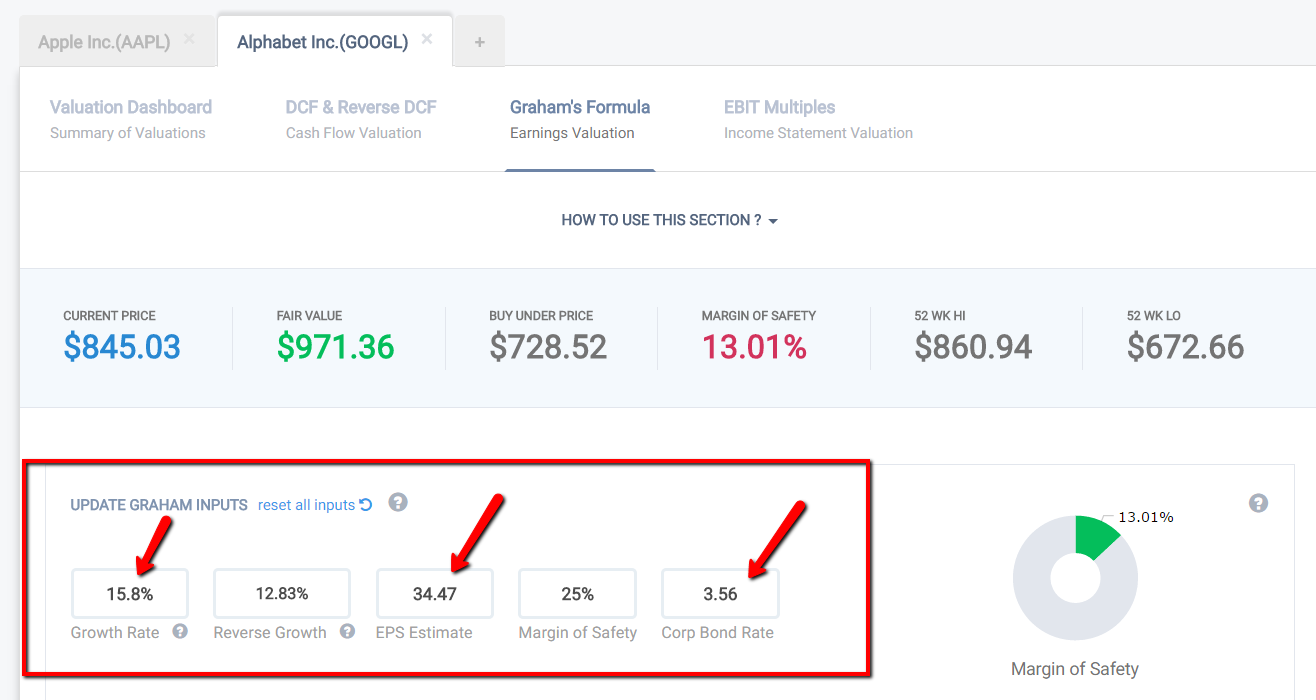
Alphabet
- EPS = 34.47
- g = 15.8%
- Y = 3.56%
(Click on image to enlarge)

Graham Formula Calculator
The resulting Graham formula gives a value of $971.36
An important point to keep in mind is that when Graham provided this equation, it was to simulate a growth stock based on the concepts of value investing.
Let’s look at Facebook (FB).
- EPS =4.14
- g = 29.4%
- Y = 3.56%
(Click on image to enlarge)

Ben Graham Formula Calculation with OSV Spreadsheet Analyzer for Facebook
The intrinsic value comes out to $186.29.
If I used the original Graham’s Formula, this is what Facebook would look like.
(Click on image to enlarge)

Original Ben Graham Formula Calculation Used
You can see the big difference.
My adjusted version of no growth PE of 7 and 1xg compared to the original version of 8.5 and 2xg.
What this shows is that:
- the original Graham’s formula is aggressive
- should be considered as the upper range
- needs to be put into today’s context
There was no Facebook, Microsoft, Google back in Graham’s time.
High growth companies didn’t achieve 30, 40, 100% growth like some do today.
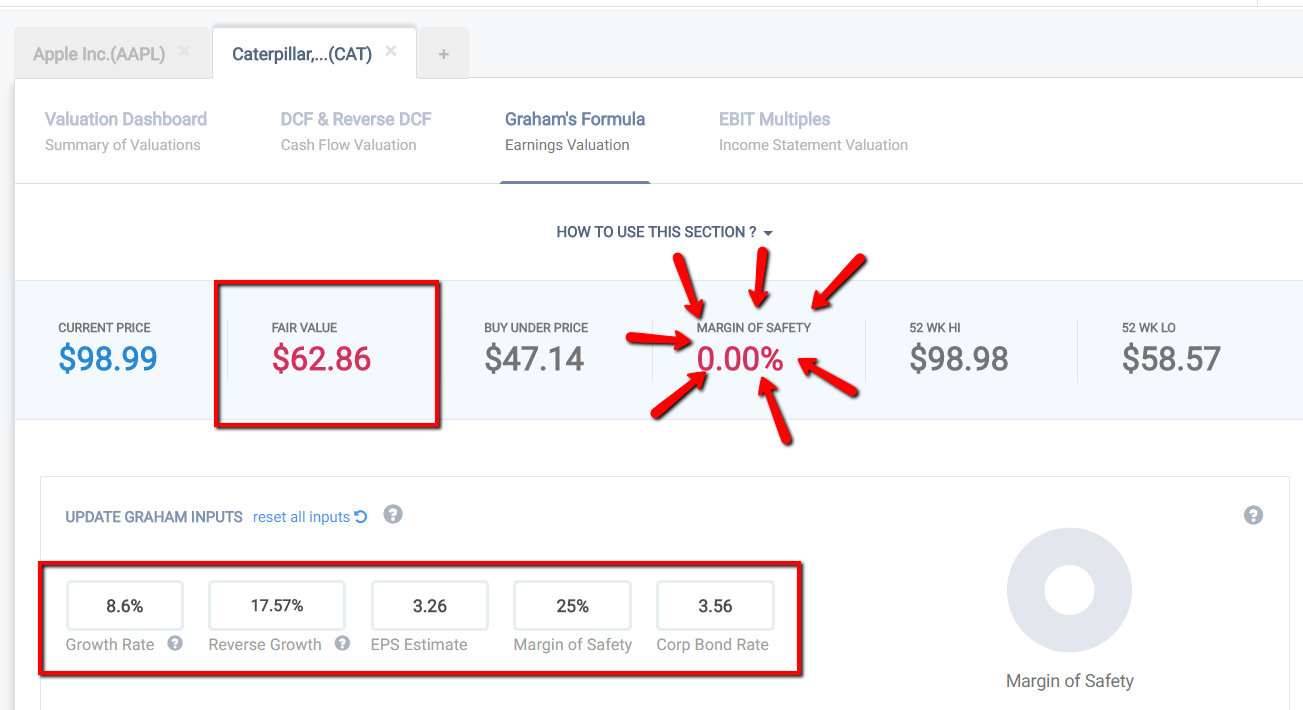
On the other end of the spectrum, here’s the calculation for Caterpillar (CAT).
(Click on image to enlarge)

Caterpillar Graham Calculation Example
- EPS is 3.26
- The expected growth rate is 8.6%
- Corp rate is 3.56%
Additionally, based on the current price and if you reverse engineer the Graham’s Formula, it tells you that the market is expecting a 17.57% from the current price.
The actual forward looking growth is much lower at 8.6%.
Thus the Graham’s formula comes out to $62.86 with a zero margin of safety.
Summing Up
Benjamin Graham offered a very simple formula to calculate a growth stock. It can be applied to other sectors and industries, but you must put it into context by adjusting the original formula.
Always practice margin of safety investing as well as understanding that valuation is finding a range of numbers. There is no such thing as an absolute range. Consider the Graham Formula to be the upper end of the valuation range.
Disclosure: None.


Thanks for sharing.