
Historic Divergence In Tech Price And Breadth
Each day in our Sector Snapshot, we highlight the overbought and oversold readings of each S&P 500 sector based on price and breadth. For price, we consider a sector to be overbought when it trades at least one standard deviation above its 50-DMA and oversold when it is one standard deviation below its 50-DMA.For breadth, we look at the 10-day advance-decline lines. Again, when the 10-day A/D line rises at least one standard deviation above its historical average it can be considered overbought and vice versa.
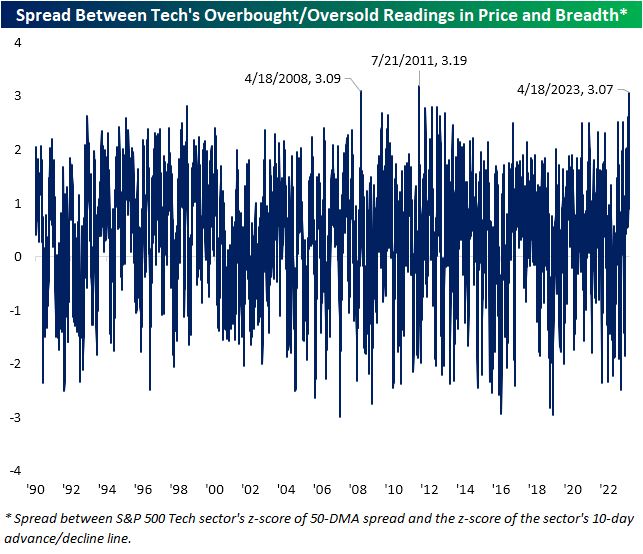
The Tech sector is in an unusual place in which price has been overbought for the entirety of the past month while short-term breadth has dropped into oversold territory in the past two sessions.

Taking a spread of the two measures, that is nearly a record divergence. As shown below, there have only been two other times in which there has been a three-standard deviation difference between the overbought/oversold levels of price and breadth. The most recent of these was in July 2011 when similar to now, the sector traded over 1.4 standard deviations above its 50-DMA while the 10-day A/D line was over a standard deviation below its historical average. The other instance was exactly 15 years ago in April 2008. That time was slightly different in that price was extremely overbought trading 3 standard deviations above its 50-DMA while breath was neutral and only slightly negative.
Given the Tech sector has managed to perform well on unimpressive breadth, it would imply mega caps are buoying the market cap-weighted index.
More By This Author:
Homebuilder Sentiment And Stocks Trend In Opposite Directions
Europe Treasure
Sentiment: Back To The 20s
Disclaimer: Bespoke Investment Group, LLC believes all information contained in this report to be accurate, but we do not guarantee its accuracy. None of the information in this report or any ...
more

