
Forget The Golden Cross: These Overlooked Clues Could Signal The Market’s Next Big Move

Image Source: Unsplash
Discover why the usual Golden Cross might be fooling traders — and how falling supply, demand tails, and the overlooked 200-day moving average could reveal the S&P 500’s next move.
Watch the video from the WLGC session on 15 Jul 2025 to find out the following:
- Is the Golden Cross really a reliable buy signal for the S&P 500 — or just a classic bull trap?
- What hidden clues in volume spikes suggest the market's next big move?
- Why might the 200-day moving average matter more than flashy crossovers like the Golden Cross or Death Cross?
- How do tightening supply levels reveal what smart money might be planning next?
- And a lot more…
Video Length: 00:06:40
Golden Cross — Not a Silver Bullet
You’ve probably heard the hype: when the 50-day Moving Average (MA) crosses above the 200-day MA, that’s a so-called Golden Cross—supposedly a bullish signal.
But these crosses are lagging indicators. By the time you see the cross, much of the move is over. For instance, back in April, the death cross (bearish cross) signaled after the structure had already broken down.
200-day MA: A More Reliable Guide
Instead of focusing on crosses, the 200-day MA acts as dynamic support or resistance. Tracking whether price respects this level—such as bouncing after a retest or selling off on rejection—offers more timely, actionable insights.
Reading Supply and Demand
Recently, we’ve seen volume spikes (Monday and Friday sessions) but notable demand tails—suggesting buyers are stepping in.
Supply has been decreasing, boding well for bulls in the near-term. Still, be on alert: a sharp spike in supply paired with a big down day could signal the start of a correction.
Trading Context Matters
Moving averages are most useful when read within the broader context. A sideways, choppy range (like earlier this year) can make signals less reliable.
It’s critical to identify whether you’re in a trending or consolidating market—breakouts above key levels are when opportunity knocks.
What’s Next for the S&P 500?
For now, the uptrend’s intact. Even a pullback to 6150-6100 would not negate the bullish structure.
Watch for a breakout above the recent highs for further upside, as long as supply stays contained.
Bottom Line
Don't put too much faith in the golden cross alone. Instead, observe price behavior around key moving averages—especially the 200-day—and always read these signals within the broader market structure.
As of now, the S&P 500 remains constructive, but keep your eyes peeled for sudden spikes in supply as a caution sign.
Market Environment
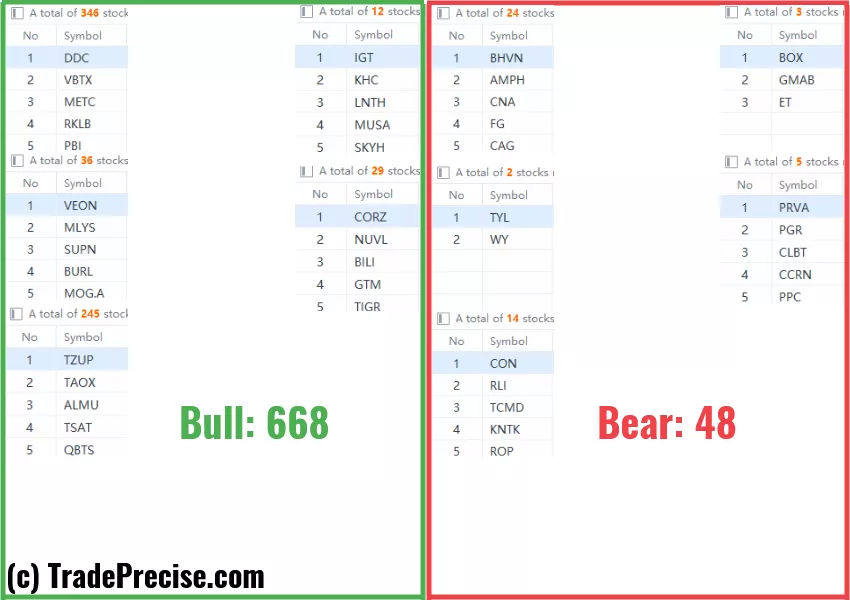
The bullish vs. bearish setup is 668 to 48 from the screenshot of my stock screener below.
(Click on image to enlarge)
3 Stocks Ready To Soar
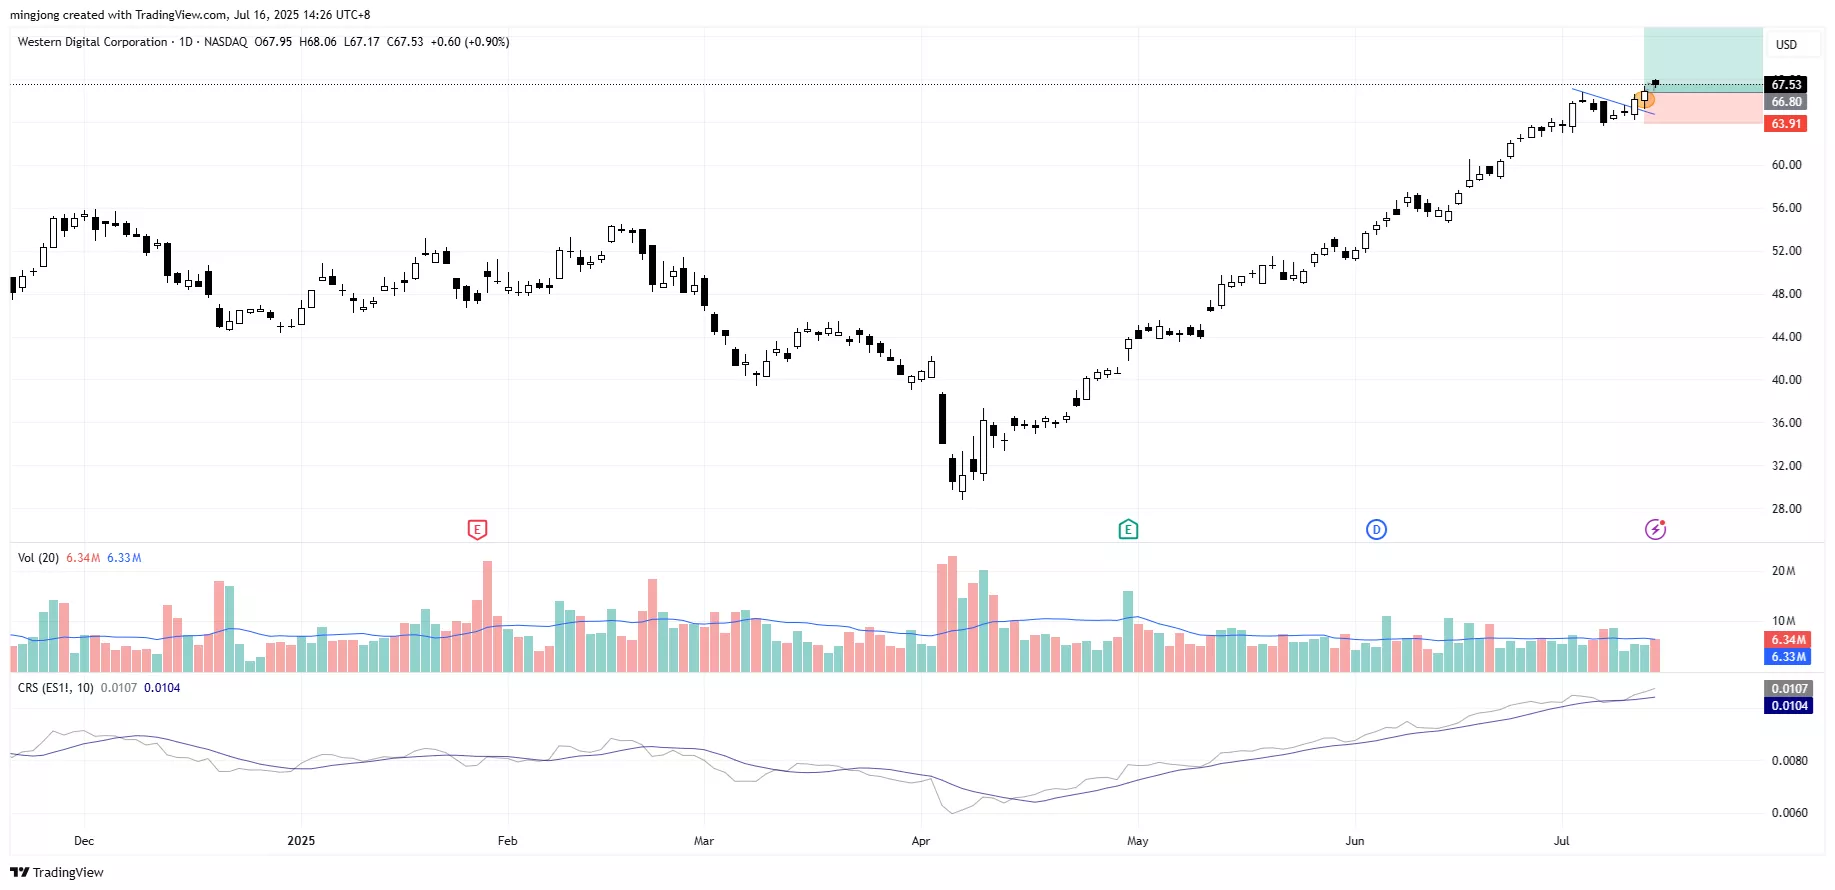
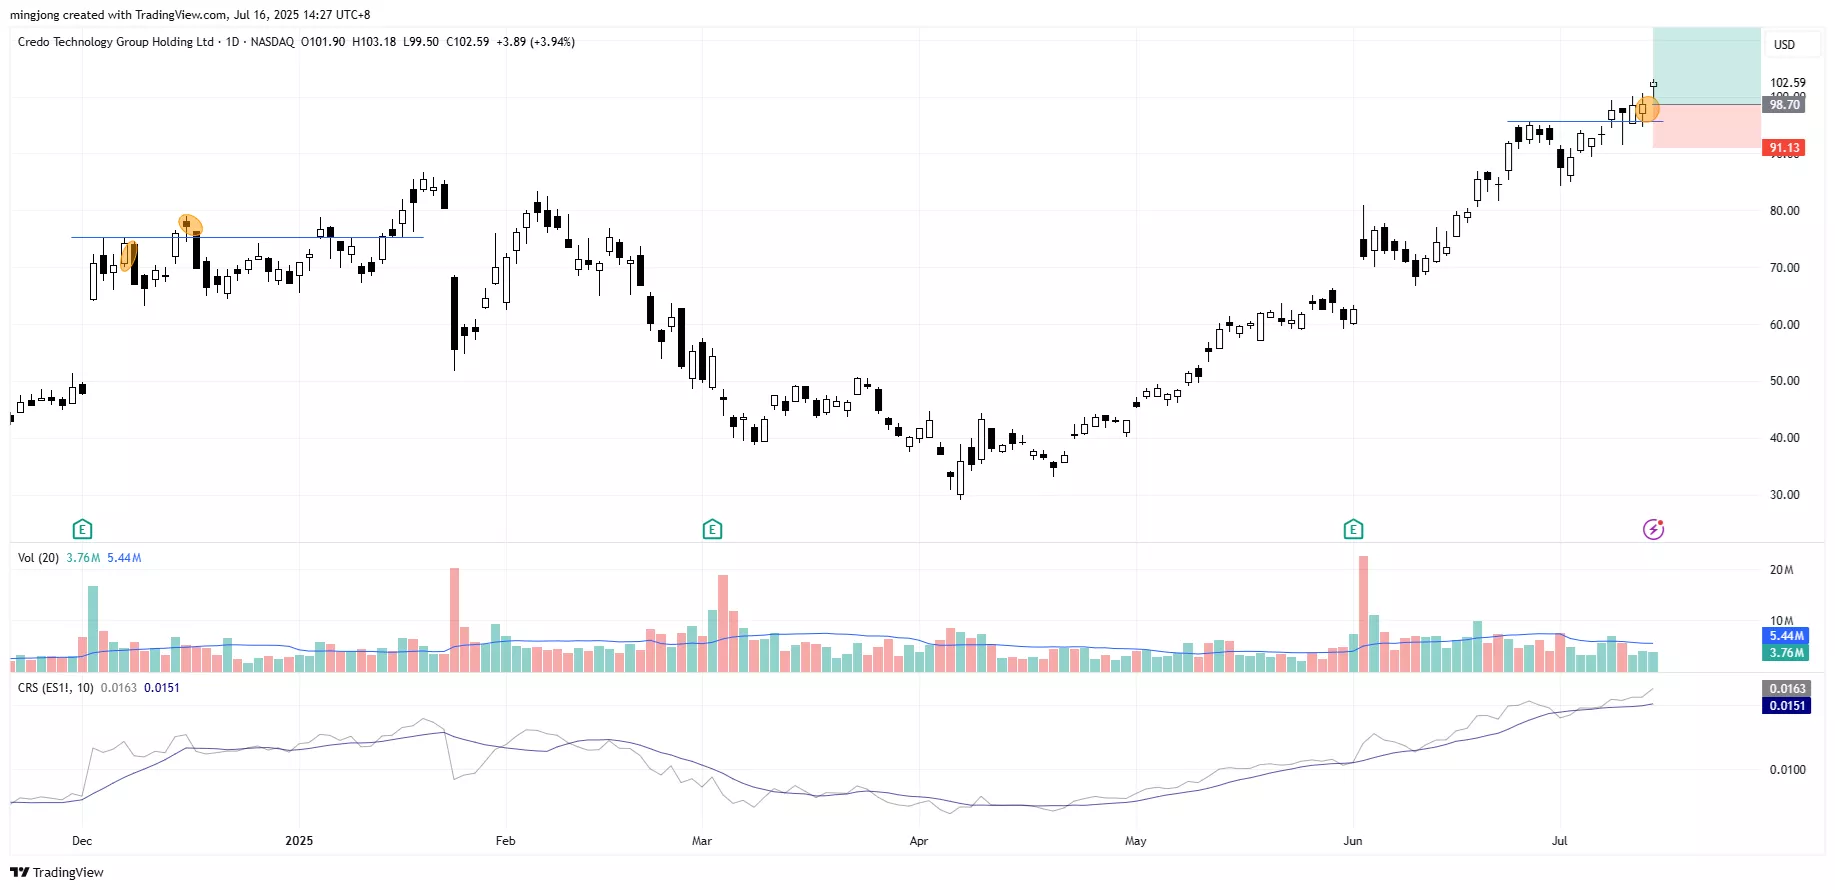
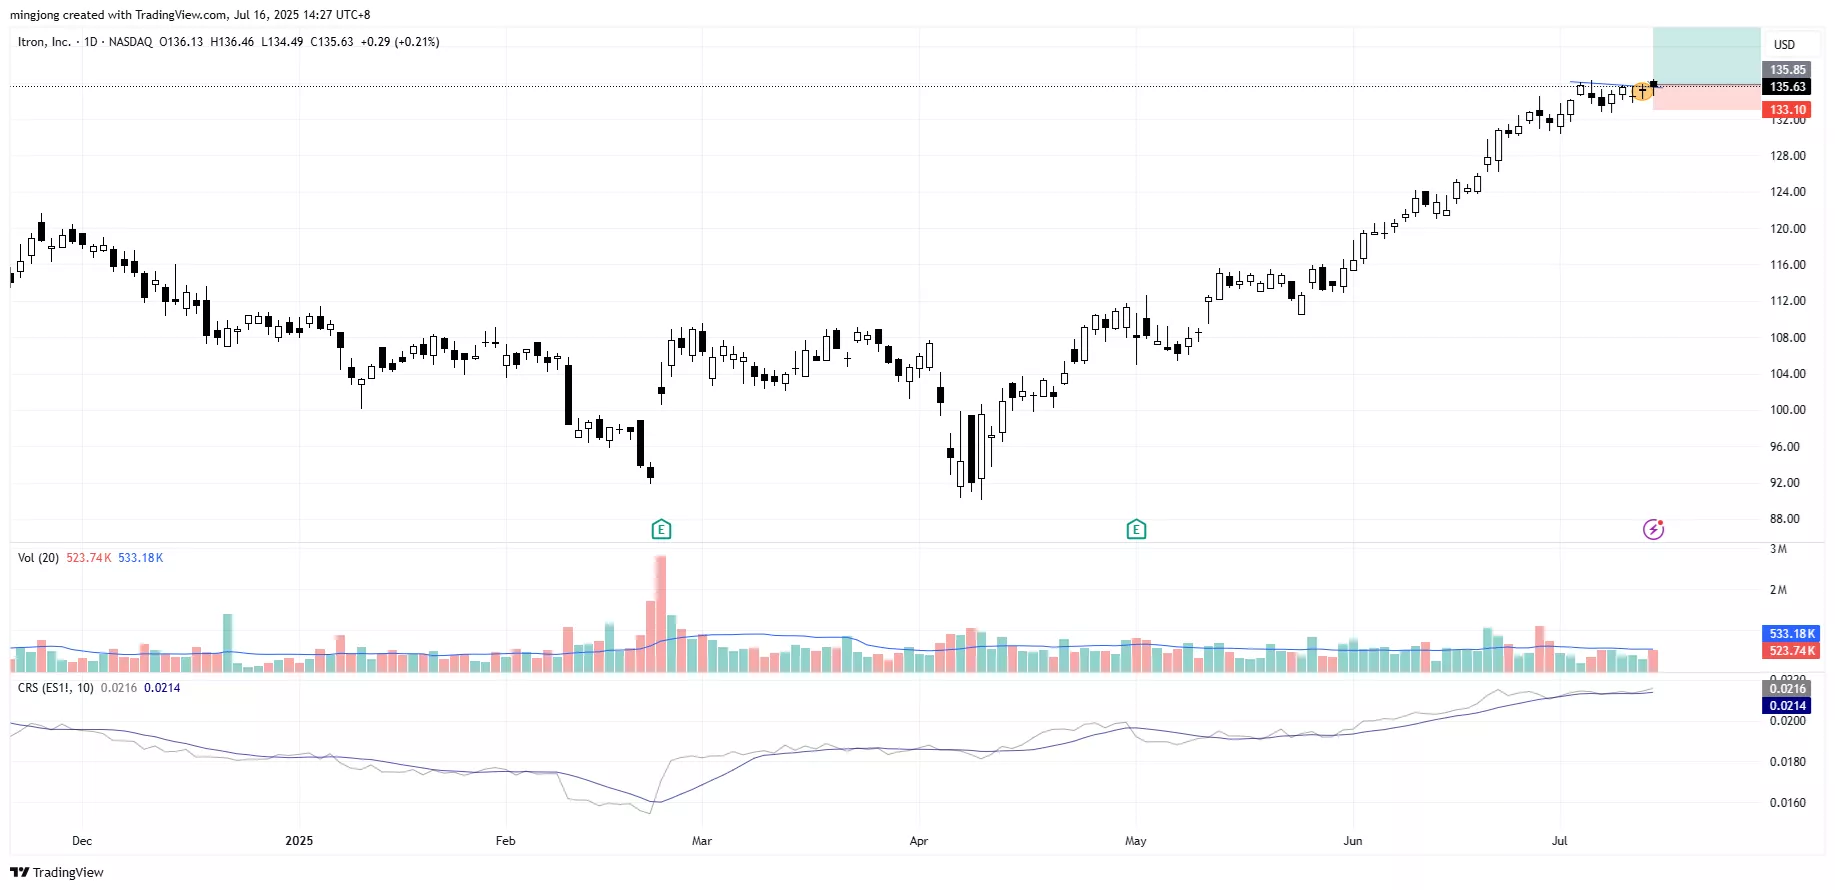
21 actionable setups such as WDC CRDO ITRI were discussed during the live session on 15 Jul 2025 before the market open (BMO).
(Click on image to enlarge)
(Click on image to enlarge)
(Click on image to enlarge)
More By This Author:
This Zone Could Set The Stage For The Next Market Surge
This Quiet Warning Sign Could Signal A Pullback
The Bull Is Still In Control — But One Spike In Supply Could Flip The Script
Disclaimer: The information in this presentation is solely for educational purpose and should not be taken as investment advice.


