
Fannie And Freddie To The Rescue
President Trump is using Fannie Mae and Freddie Mac to help make housing more affordable. According to a TruthSocial post, the President claims Fannie and Freddie have a combined $200 billion in cash. Accordingly:
I am instructing my Representatives (Fannie and Freddie) to buy $200 billion dollars In mortgage bonds.
The hope is that increased demand for mortgage-backed securities will result in lower mortgage rates. As we wrote in a recent Commentary, Fannie and Freddie currently own about $225 billion in mortgage securities. This includes a 25% increase over the past six months. The estimates we have seen for the benefits of this action range from a 0.10% to 0.50% reduction in mortgage rates. For context, there are approximately $9 trillion in agency mortgages outstanding, so $200 billion is only about 2% of the supply.
In addition to lowering mortgage rates to help housing affordability, the President announced aims to prevent large institutional investors from buying more single-family homes. Moreover, he is urging Congress to enact such a ban into law. It is estimated that institutional investors own approximately 450k homes. The largest of these includes Progress Residential (owned by Pretium Partners), which owns nearly 100,000 homes. Invitation Homes (a public REIT originally spun off from Blackstone) has between 85k and 90k homes. American Homes 4 Rent and Blackstone follow. While such an institutional ban may help on the margins, it doesn’t address the smaller “mom and pop” landlords. The graph below, courtesy of John Burns Research, breaks down investor home ownership. 25% of homes sold last year went to investors, of which a good chunk of those were individuals, not larger institutions.

What To Watch Today
Earnings
- No earnings releases today.
Economy
- No notable economic reports today
Market Trading Update
The S&P 500’s close at 6,966 on Friday confirmed the market remains in a bullish uptrend, continuing the positive trajectory that began in mid‑2025. Price action this week gained traction and has been tracking the rising bullish trendline from the November lows, printing a new all-time high on Friday. Technical indicators remain bullish and not overbought with a momentum “buy signal” intact. However, weak money flows continue to suggest some caution below the surface.
(Click on image to enlarge)

The price remains above its major moving averages, with the index trading above both the 20-day and 50-day moving averages. This alignment has remained a hallmark of the market since the April 2025 lows, and retracements to those moving averages continue to find buyers.
Notably, market breadth improved early in the week as more stocks participated in the advance, reflecting a broader rally that extended beyond just mega-cap technology names. As noted above, value has gained some traction in recent weeks, and the number of S&P 500 constituents in positive territory has improved. However, despite the broader advance, a divergence remains, with fewer stocks leading the market higher. Divergences like this can signal internal weakening, even as the headline index reaches new highs.
Volatility measures also remain bullish with the VIX and related volatility gauges printing near historically low ranges, indicating that investors are not pricing large near-term swings. Low implied volatility tends to reflect complacency, but also underscores that significant breakouts or breakdowns have less feared market reaction priced in.
Overall, the S&P’s advance this week lacked strong momentum expansion, but the technical support remains intact, and the market’s inability to push convincingly to new highs suggests a battle between profit‑taking and fresh buying remains. This puts emphasis on key support levels, which will be critical for next week’s directional bias.
S&P 500 Technical Levels for Traders
| Level Type | Price Level | Technical Significance |
|---|---|---|
| Near‑Term Resistance | 6.966 | Friday’s close. |
| Secondary Resistance | 7,000 | Psychological resistance level. |
| Initial Support | 6,899 | Last week’s price action lows. |
| 20-Day Moving Average Support | 6,874 | Short‑term pullback reference |
| 50‑Day Moving Average Support | 8,818 | Dynamic technical support zone |
| 200‑Day Moving Average Support | 6,323 | Longer‑term trend support |
Traders should view the 7,000–7,050 range as a key control zone for the market. If the index closes above this range with expanding volume, it increases the likelihood of continuation toward higher highs. Support at 6,900 is the first significant demand zone; loss of this area would expose the 50‑day average as a deeper test of trend integrity.
Employment Report & The Week Ahead
Per the BLS, the economy added 50k jobs last month, and the unemployment rate fell by 0.1% to 4.4%. The bad news is that the prior two months were revised lower by 74k jobs. Powell stated at the last FOMC meeting that the Fed thinks the initial BLS numbers are overstated by 60k. Thus, Friday’s 50k gain may ultimately be a slight loss of jobs. While the numbers are not overly troubling, they do raise concerns about sentiment and, ultimately, personal consumption. The Daily Shot graphs below show that perceived job security continues to worsen, and confidence in finding new employment slumped to the lowest level in at least ten years.
With the fresh round of employment data in hand, the market will turn its attention to inflation. On Tuesday, the BLS will release the CPI report. The current estimate is for a gain of 0.2%, which would reduce the year over year rate by 0.1% to 2.6%. On Wednesday, PPI is expected to also show a 0.2% increase, while Retail Sales is forecasted to be up by 0.3%. Retail Sales, covering December, will provide some indication of the pace of holiday sales. Given poor measures of consumer sentiment, we are concerned that the next rounds of Retail Sales reports will be weak. It appears that holiday spending was decent, but that may come at the cost of frugality in the first few months of the new year.
Led by JPM on Tuesday, the banking sector will kick off fourth-quarter earnings reports this week.
There will be a host of Fed speakers throughout the week as investors start to gauge what the January 28th FOMC may entail. Given the recent labor market reports, another below-expected CPI print could warrant a Fed rate cut at the next meeting.

New Year’s Resolutions For 2026: Investors Version
I try to follow this list every year, and, like every year, I screw up a few items. That’s okay. The goal isn’t to be perfect; it’s to make fewer mistakes than last year because investing success doesn’t come from reading motivational quotes or watching market TikToks at midnight.
Like fitness, you don’t get results because you “bought” a gym membership. You get them because you showed up when it was hard. Investing is the same. There are no shortcuts and no magic formulas. There are only basic rules, boring discipline, and the consistency to do them longer than the guy next to you.
Want to be a better investor? Then keep your resolutions, even when the market gives you every reason not to.

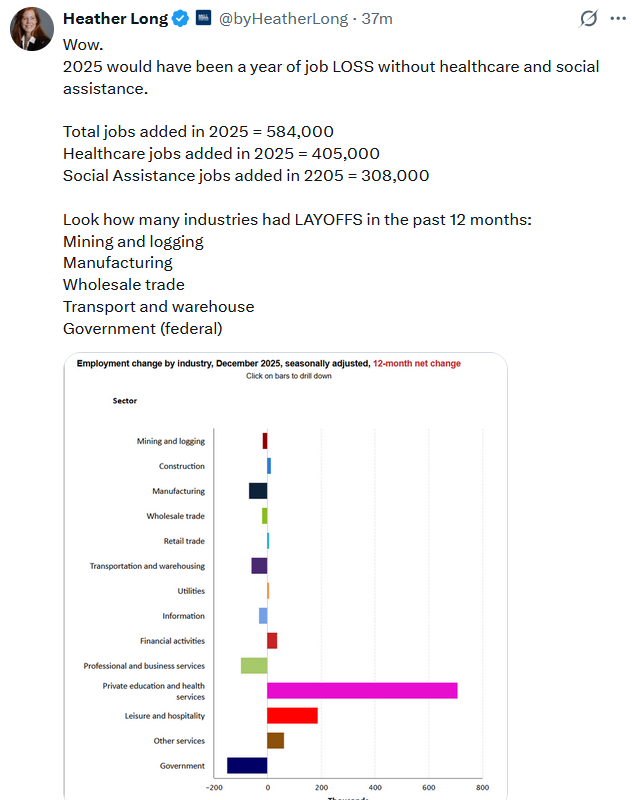
Tweet of the Day
More By This Author:
Investor Lessons From 2025 For 2026New Year’s Resolutions For 2026 – Investor Version
Stagnation Is Lulling The Fed To Sleep
Disclaimer: Click here to read the full disclaimer.


