
Embracing Market Dynamics As Inflation Data Looms

Image Source: Pexels
Markets are Constantly Evolving
Last week, watching U.S. equities was akin to watching paint dry – very dull and without drama. The price ranges in the major indices were tiny, the volume was minuscule, and there was little in the way of news items or action. However, this week appears to be precisely the opposite. “Meme” stocks like GameStop (GME - Free Report) and AMC (AMC - Free Report) exploded after the popular internet personality “Roaring Kitty” emerged from the darkness and tweeted. Meanwhile, the hated and underfollowed bull market in Chinese equities continues with ADRs like Alibaba (BABA - Free Report) and Futu Holdings (FUTU - Free Report) each gaining more than 5% on heavy turnover (BABA will report EPS in the morning).
However, the fun is just getting started...
Economic Calendar
Beyond the furious action in individual names, investors will need to parse through several economic numbers and known market events.
Tuesday, May 14th: Producer price index (PPI) @ 8:30 am EST, Fed Chair Jerome Powell speaks @ 10:00 am EST
Wednesday, May 15th: Consumer price index (CPI), U.S. retail sales@ 8:30 am EST
Short-Term Market Outlook
Stubborn inflation has been the proverbial “pebble in the shoe” for Jerome Powell and the Fed. As a result, investors should expect a spike in volatility later this week. With the S&P 500 Index ETF (SPY - Free Report) up seven straight sessions, a short-term pullback is not out of the question and would not be abnormal. Furthermore, according to data from Jeffrey Hirsch (Almanac Trader), the S&P 500 Index has been lower 11 of the last 15 May monthly options expiration weeks (which we are in now).
Intermediate/Long-Term Outlook
Understanding that time frames can give conflicting data is paramount to investing success when analyzing the market. The intermediate to long-term view paints a much more bullish picture.
Put/Call Ratio
The put/call ratio is a great metric for understanding market froth and retail sentiment. Though there were some breathtaking moves in individual names today, the put/call ratio is hovering near normal levels and is not showing any signs of overheating.
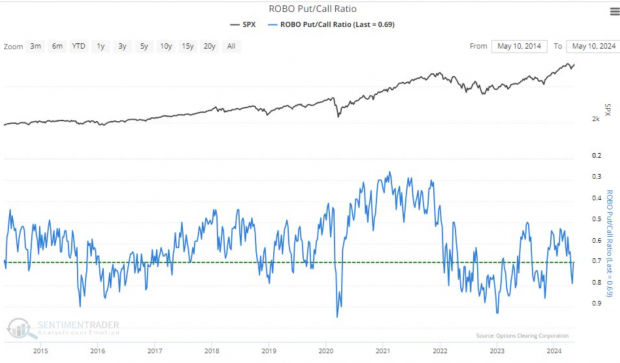
Image Source: Sentimentrader
Fear & Greed
The CNN Fear and Greed Index paints a similar picture to the put/call ratio. Though the major indices are a hair-off all-time highs, the CNN Fear and Greed Index is showing a “Neutral” sentiment.
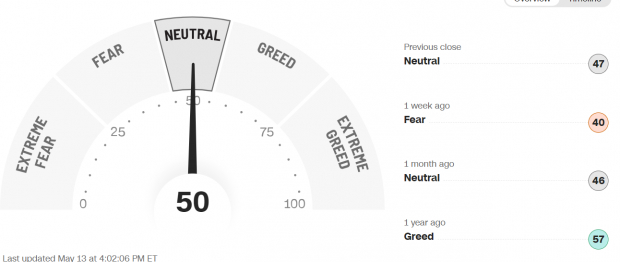
Image Source: CNN
Broad Participation
The Net New Highs Indicator shows that more stocks are making new highs than lows. In other words, participation is broadening as stocks trend higher.
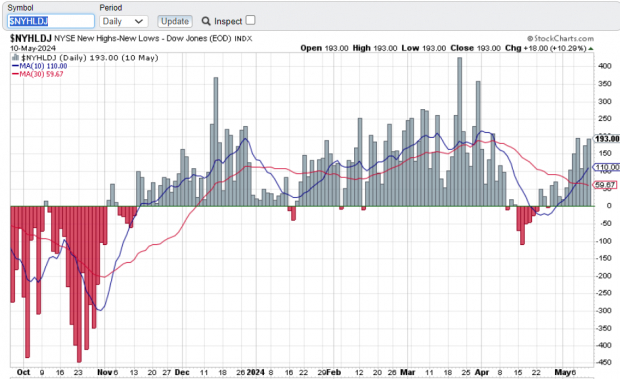
Image Source: Stockcharts.com
Bottom Line
As investors wait for key economic events, they are bracing for short-term volatility. While the data points to volatility in the short-term, the intermediate/long-term picture appears to be bullish.
More By This Author:
4 Factors Point To A Sunny Future In SolarBear of the Day: Hertz
Bull Of The Day: Coinbase Global
Disclosure: Zacks.com contains statements and statistics that have been obtained from sources believed to be reliable but are not guaranteed as to accuracy or completeness. References to any ...
more

