

Image Source: Unsplash
Texas Instruments Inc., Elliott Wave Technical Analysis
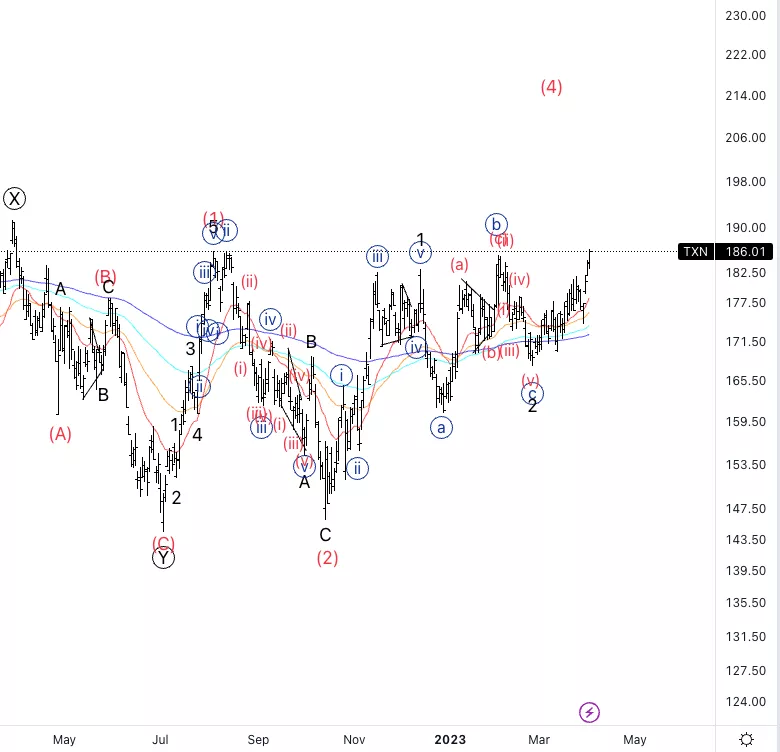
Texas Instruments Inc., (Nasdaq: TXN): Daily Chart, 3 April 2023.
TXN Stock Market Analysis: It has been moving higher ever since we entered the long trade. We are looking at much more upside into wave 3 of (3). We just got rid of the triangle scenario as we broke past the top of wave (1).
TXN Elliott Wave Count: Wave 3 of (3).
TXN Technical Indicators: Above all averages.
TXN Trading Strategy: Looking for a clear five wave move to then look for the upside.
Analyst: Alessio Barretta
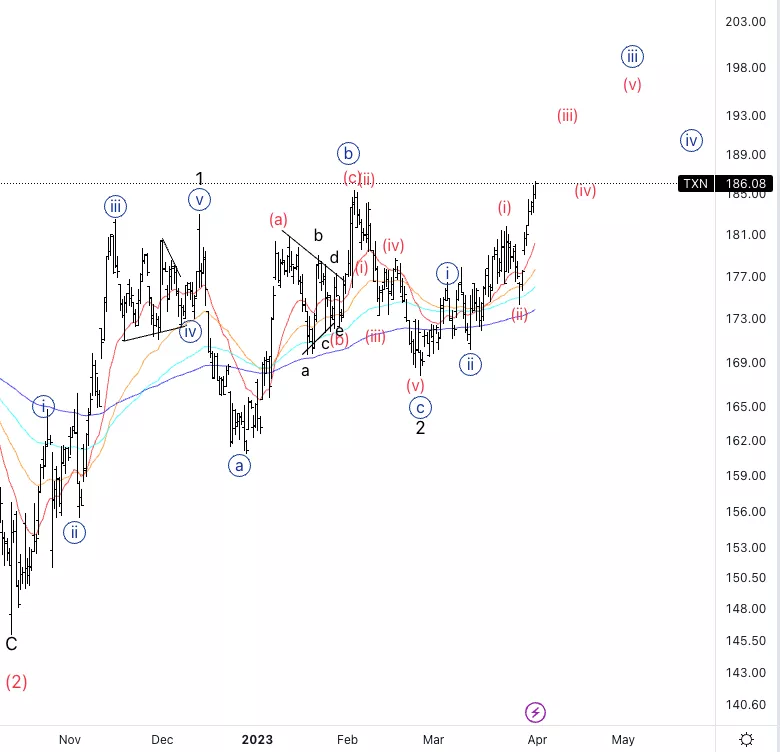
Texas Instruments Inc., TXN: 4-hour Chart, 3 April 2023.
Texas Instruments Inc., Elliott Wave Technical Analysis
TXN Stock Market Analysis: Looking for a nest within wave {iii} as we seem to be having a leading diagonal in wave {i} and (i) which makes sense given the fact the whole count has been very challenging and many times waves one are the hardest to identify as they get confused with corrective waves.
TXN Elliott Wave count: Wave (iii) of {iii}.
TXN Technical Indicators: Above all averages.
TXN Trading Strategy: Looking for a pullback in wave (iv).
More By This Author:
Elliott Wave Technical Analysis: Polkadot/USD, Monday, April 3
Elliott Wave Technical Analysis: Pinduoduo Inc.
Elliott Wave Technical Analysis: Binance/U.S. Dollar


Comments
Log in or sign up to join the conversation.