

Photo by Kanchanara on Unsplash
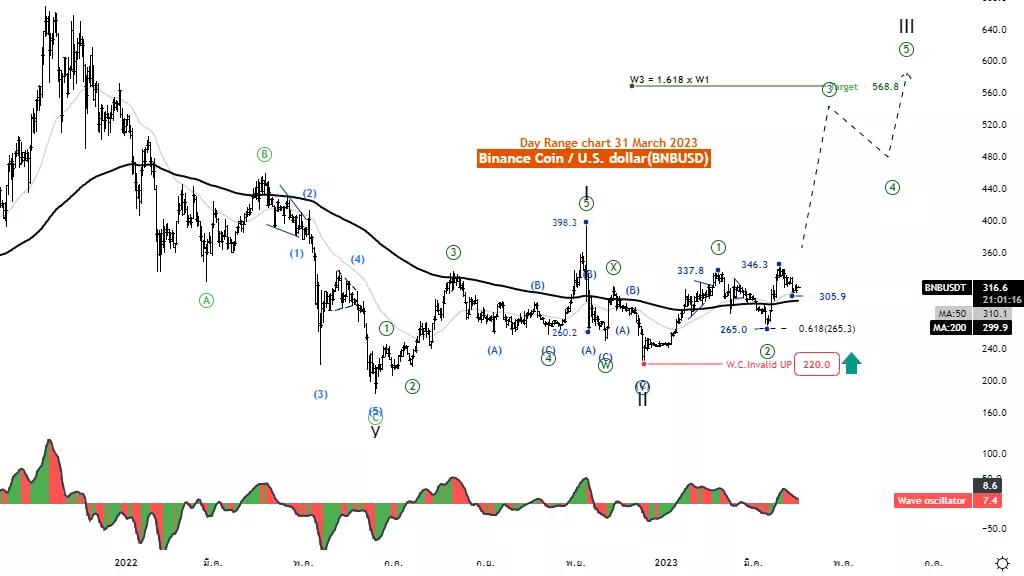
Elliott Wave Analysis TradingLounge Daily Chart, 31 March 2023.
Binance /U.S. Dollar(BNBUSD)
BNBUSD Elliott Wave Technical Analysis
Function: Follow trend
Mode: Motive
Structure: Impulse
Position: Wave III
Direction Next higher Degrees: wave (I) of Motive
Details: Wave 3 is equal to 1.618 multiplied Length of wave 1 at 568.8
Wave Cancel invalid level: 220
Binance /U.S. Dollar (BNBUSD) Trading Strategy: BNB is recovering well. And we expect wave ((2)) to end at the level of 265.0. Five rising waves from this point and the price can break the MA200 line will support this idea. The price is likely to trade above the 568.8 level.
Binance /U.S. Dollar (BNBUSD) Technical Indicators: The price is above the MA200 indicating an uptrend. The wave oscillators above Zero-Line momentum are bullish.
Analyst: Kittiampon Somboonsod, CEWA
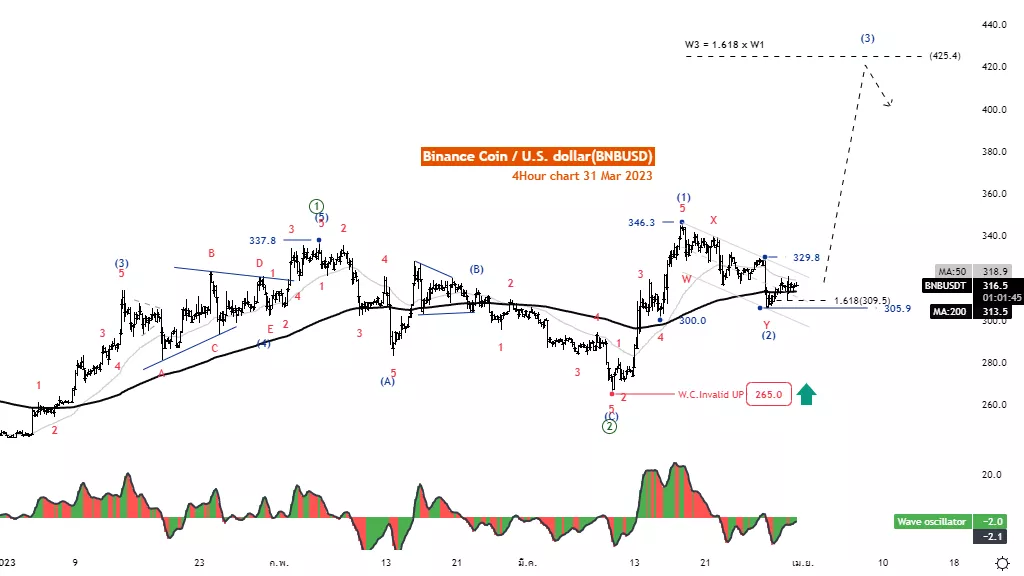
Elliott Wave Analysis TradingLounge 4H Chart, 31 March 2023.
Binance /U.S. Dollar(BNBUSD)
BNBUSD Elliott Wave Technical Analysis
Function: Follow trend
Mode: Motive
Structure: Impulse
Position: Wave III
Direction Next higher Degrees: wave (I) of Motive
Details: Wave 3 is equal to 1.618 multiplied Length of wave 1 at 446.4
Wave Cancel invalid level: 265.0
Binance /U.S. Dollar (BNBUSD) Trading Strategy: BNB is recovering well. And we expect wave ((2)) to end at the level of 305.9. Five rising waves from this point and the price can break the MA200 line will support this idea. The price is likely to trade above the 425.4 level.
Binance /U.S. Dollar (BNBUSD) Technical Indicators: The price is above the MA200 indicating an uptrend. The wave oscillators above Zero-Line momentum are bullish.
More By This Author:
U.S. Stocks Report
Elliott Wave Technical Analysis: Lam Research Corp.
Elliott Wave Technical Analysis Chainlink/U.S. Dollar


Comments
Log in or sign up to join the conversation.