

Image Source: Pixabay
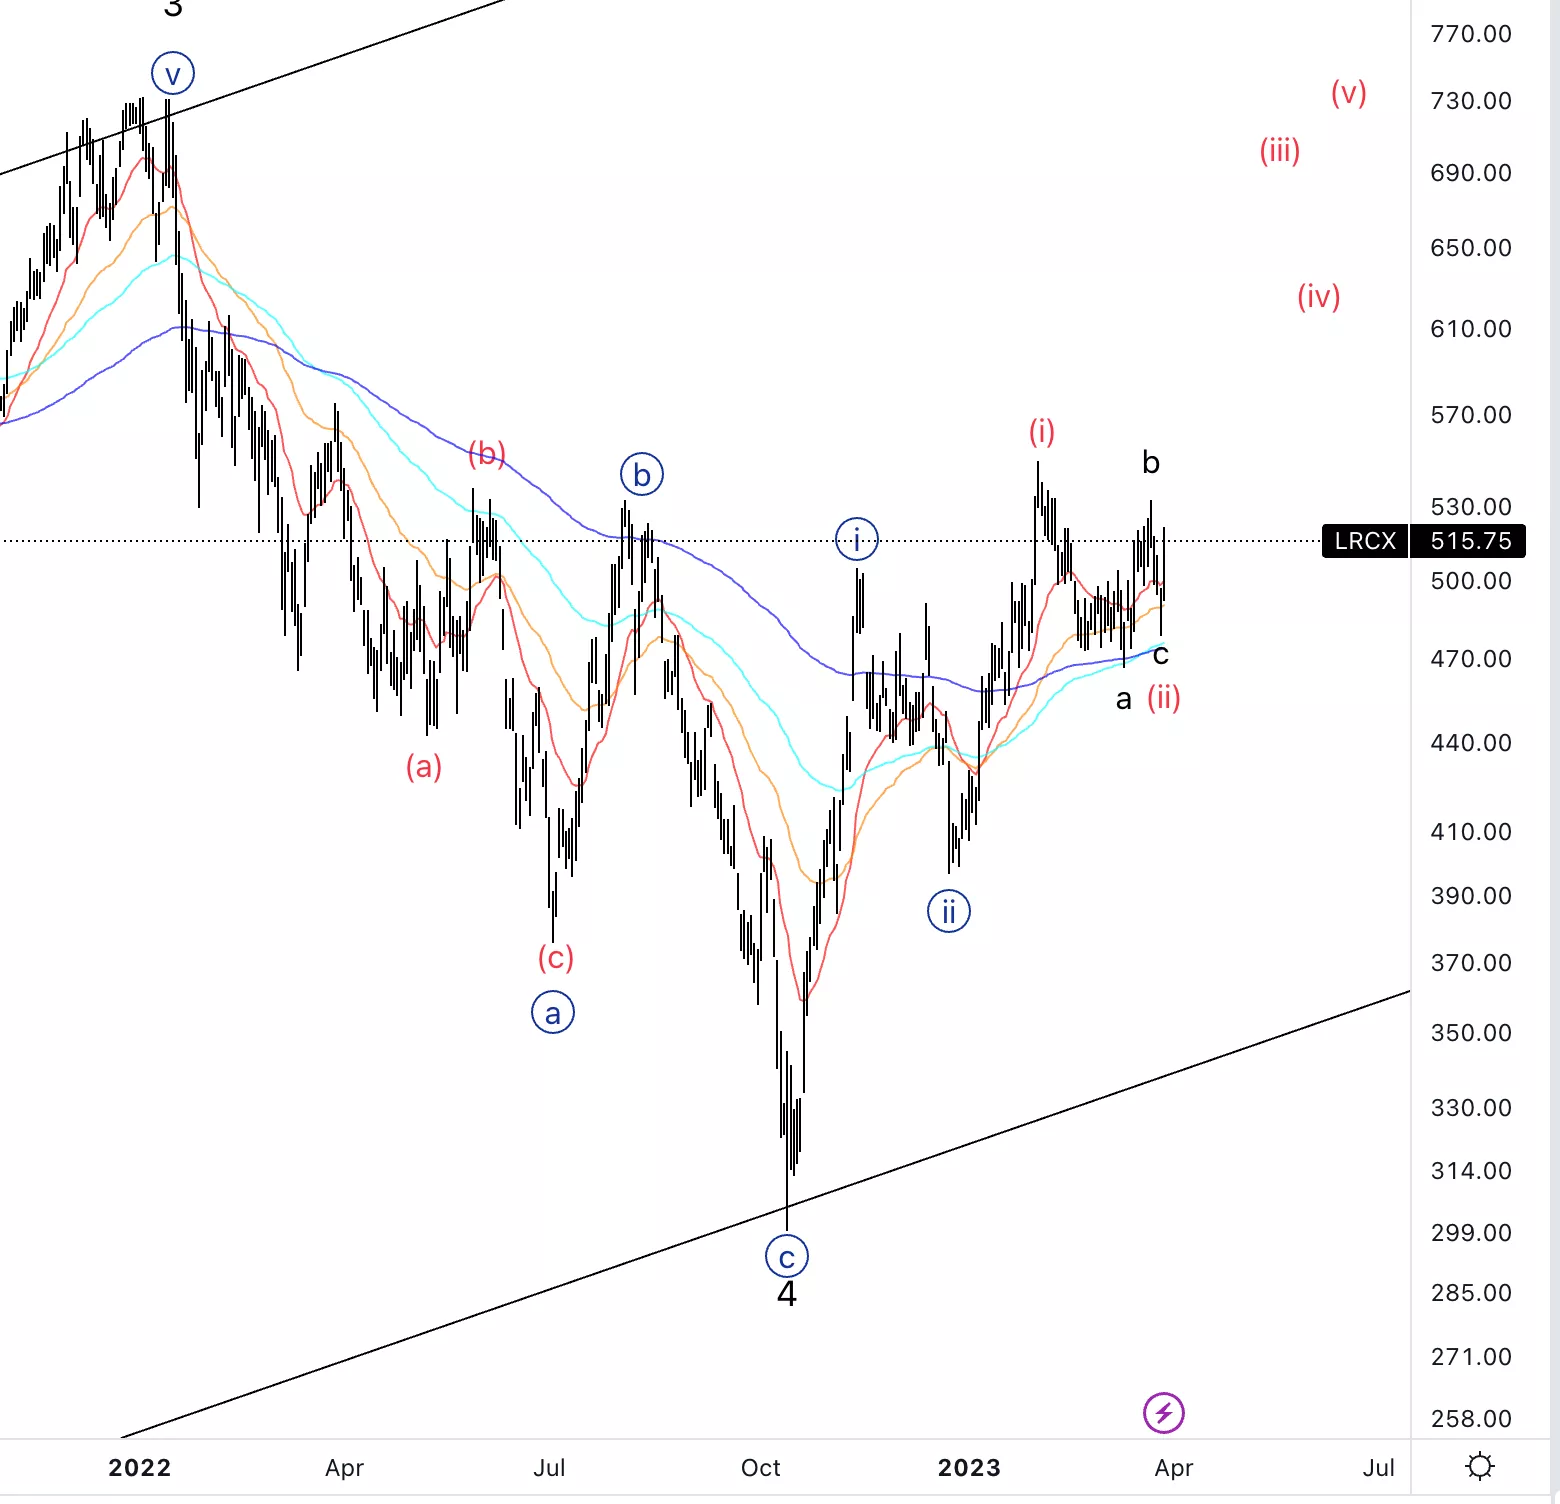
Lam Research Corp., Elliott Wave Technical Analysis
Lam Research Corp., (Nasdaq: LRCX): Daily Chart, 30 March 2023.
LRCX Stock Market Analysis: We had a sharp reaction to the upside during yesterday’s session. At this point, there is evidence suggesting we could be looking at a potential extension as labeled.
LRCX Elliott Wave Count: Wave (iii) of {iii}.
LRCX Technical Indicators: Above all averages.
LRCX Trading Strategy: Looking for upside into wave (iii).
Analyst: Alessio Barretta
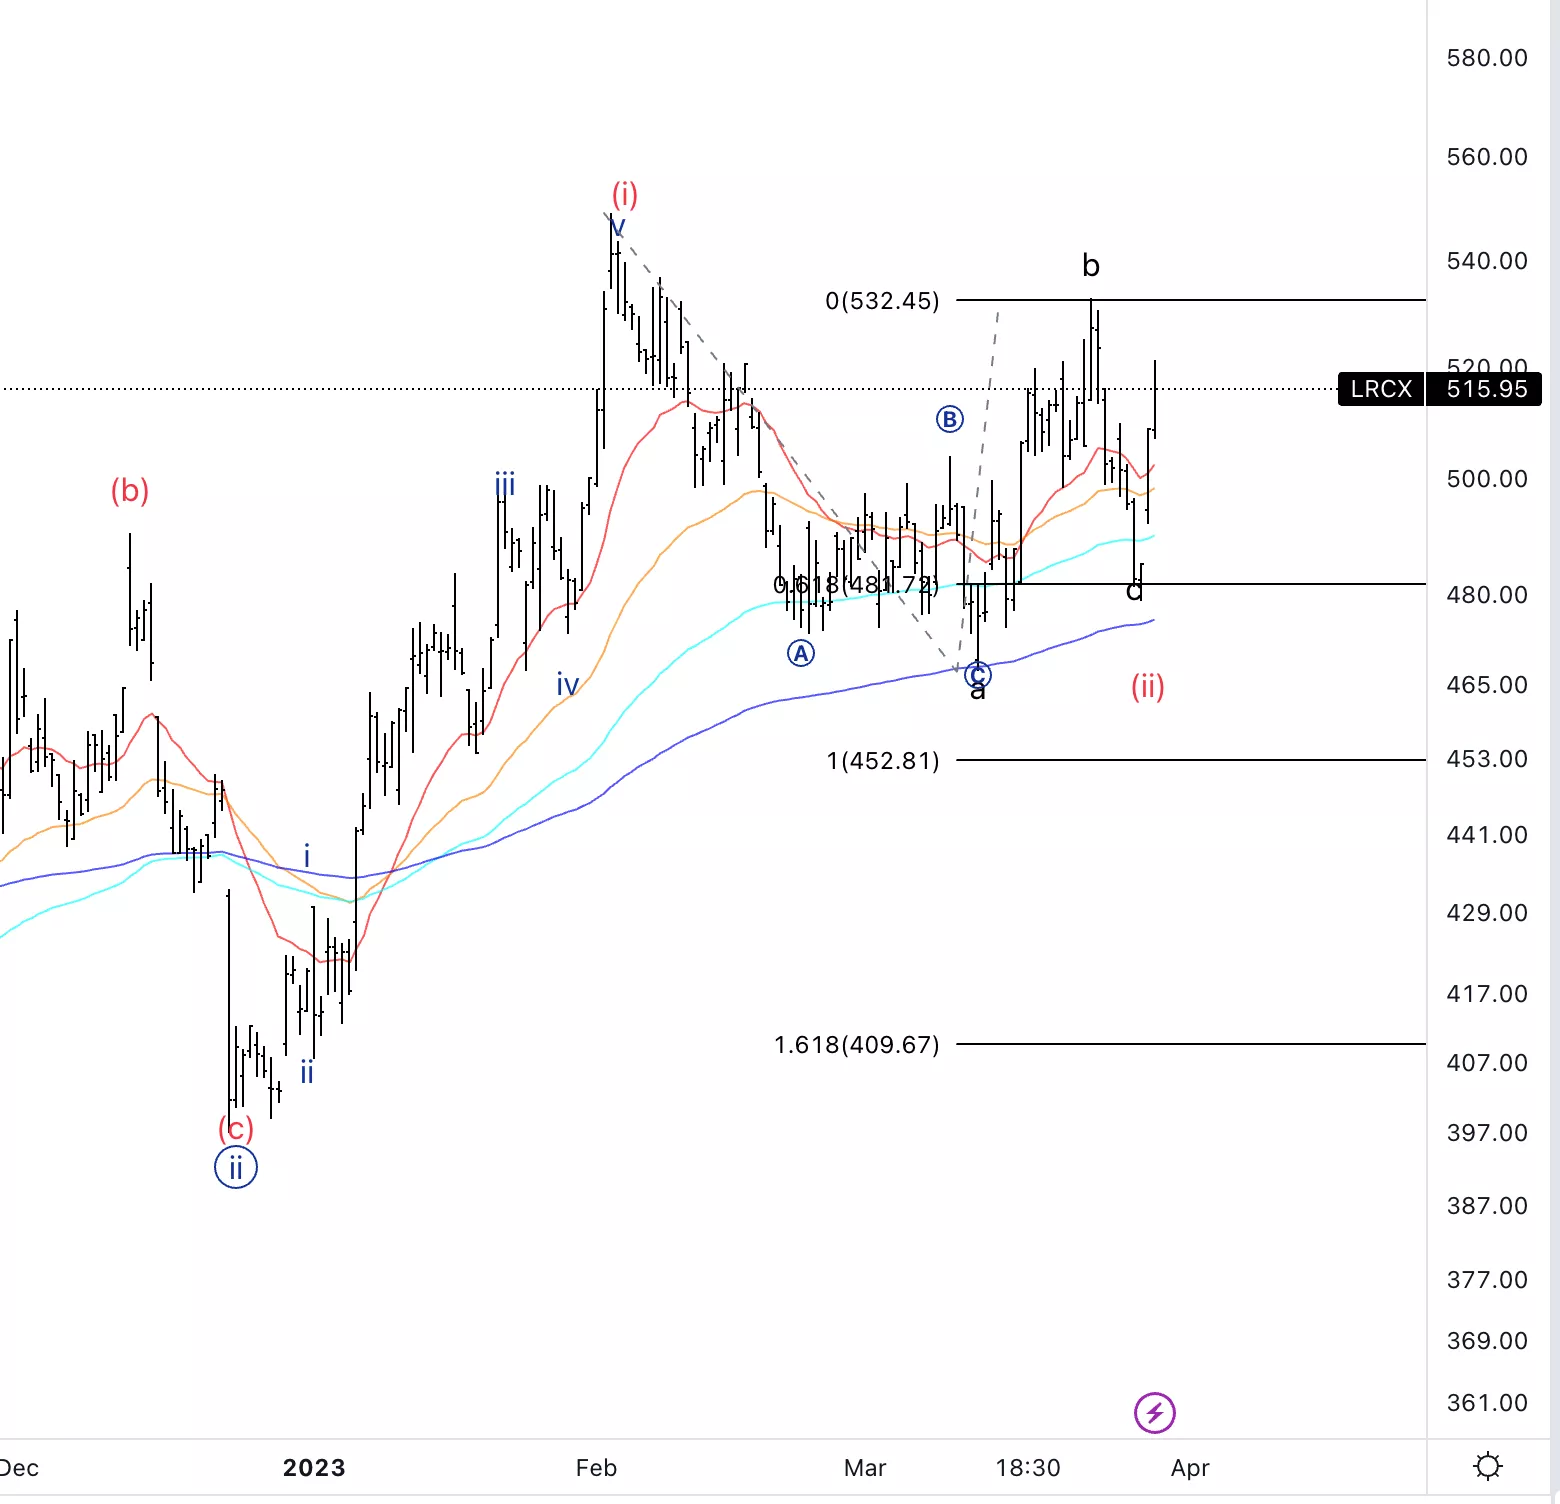
Lam Research Corp., LRCX: 4-hour Chart, 30 March 2023.
Lam Research Corp., Elliott Wave Technical Analysis
LRCX Stock Market Analysis: Having to reach 0.618 c vs. a and especially strongly reacting off it, usually signifies the bulls are back in control. In addition to that on lower time frames(1H) wave c appears as a clear five wave move, confirming the overall count. At last, if we were to continue lower wave (ii) would start to get larger than wave {ii} compromising the whole count.
LRCX Elliott Wave count: Wave i of (iii).
LRCX Technical Indicators: Above all averages.
LRCX Trading Strategy: Looking for quick short trades into wave iii.
More By This Author:
Elliott Wave Technical Analysis Chainlink/U.S. Dollar
Elliott Wave Technical Analysis: Twist Bioscience Corp. - Wednesday, March 29
Elliott Wave Technical Analysis: Cardano/U.S. Dollar


Comments
Log in or sign up to join the conversation.