

Image Source: Unsplash
Pinduoduo Inc., Elliott Wave Technical Analysis
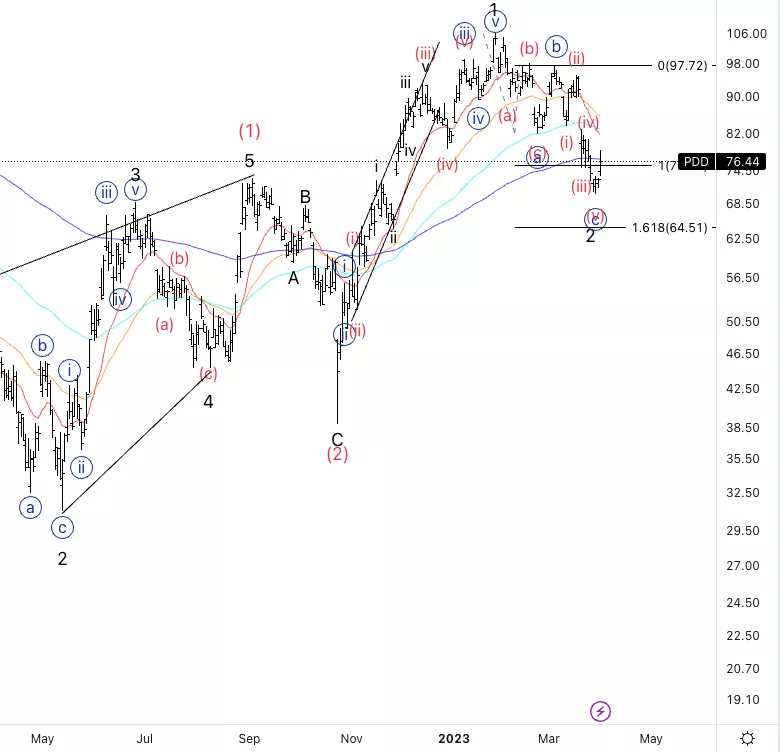
Pinduoduo Inc., (Nasdaq: PDD): Daily Chart, 31 March 2023.
PDD Stock Market Analysis: We are looking at a potential nest within wave (3). It is difficult to see this move as corrective, for a bearish alternate, therefore we can look for longs as long as we see a clear three wave move to the downside, which is what are seeing now.
PDD Elliott Wave Count: Wave {c} of 2
PDD Technical Indicators: 200EMA as support.
PDD Trading Strategy: Looking for upside into wave 3.
Analyst: Alessio Barretta
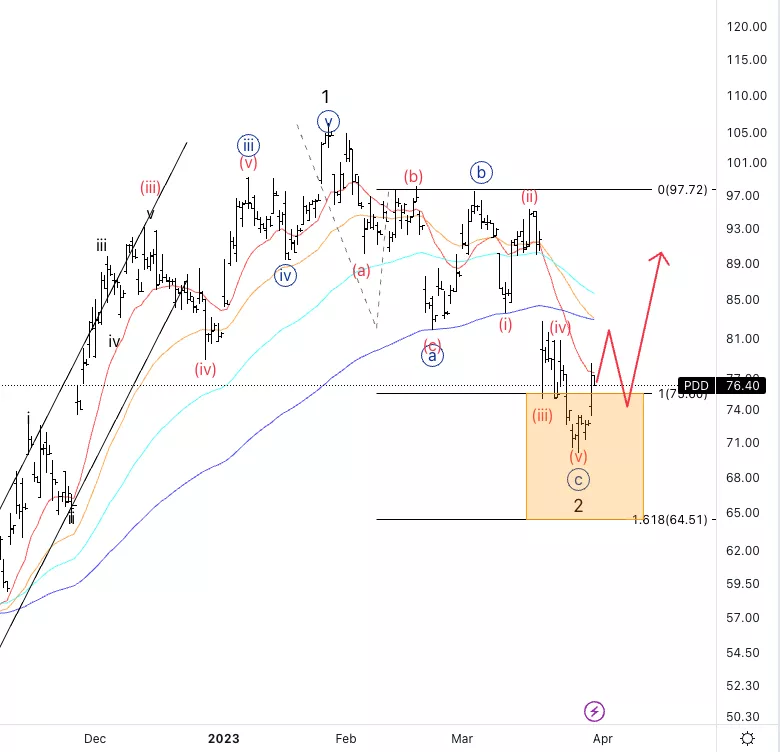
Pinduoduo Inc., PDD: 4-hour Chart, 31 March 2023.
Pinduoduo Inc., Elliott Wave Technical Analysis
PDD Stock Market Analysis: We have reacted off equality of {c} vs. {a}. We are looking for a clear five wave move into wave (i) to then look for longs.
PDD Elliott Wave count: Wave (i) of {iii}.
PDD Technical Indicators: Below all averages.
PDD Trading Strategy: Looking for longs.
More By This Author:
U.S. Stocks Report
Elliott Wave Technical Analysis: Lam Research Corp.
Elliott Wave Technical Analysis Chainlink/U.S. Dollar


Comments
Log in or sign up to join the conversation.