
Elliott Wave Technical Analysis S&P 500 Index
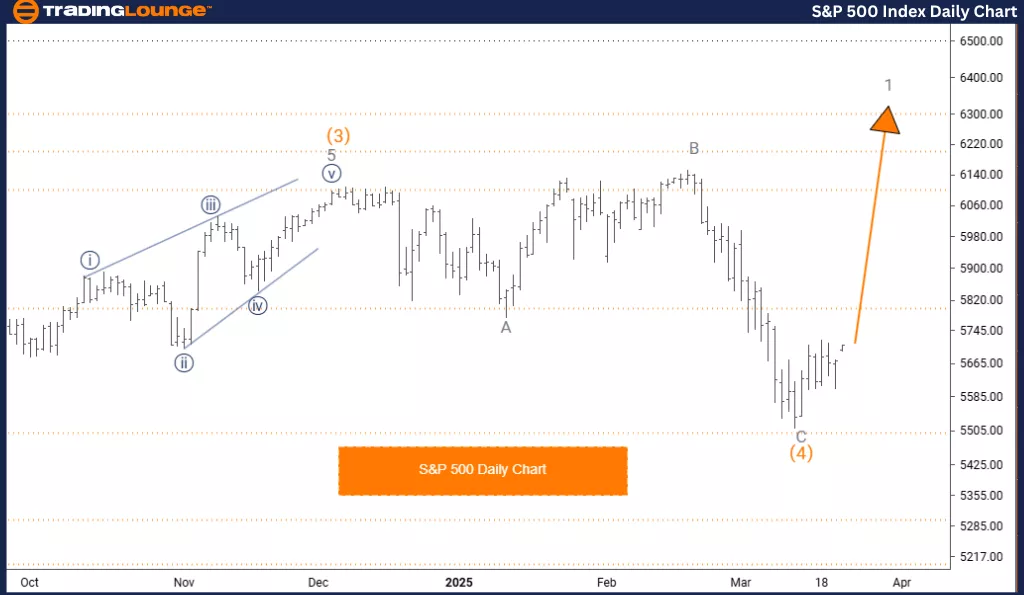
S&P 500 Elliott Wave Analysis – Daily Chart
S&P 500 Elliott Wave Technical Analysis
FUNCTION: Trend
MODE: Impulsive
STRUCTURE: Gray Wave 1
POSITION: Orange Wave 5
DIRECTION NEXT HIGHER DEGREES: Gray Wave 1 (Started)
DETAILS: Orange Wave 4 appears complete; Gray Wave 1 of 5 is now active.
The Elliott Wave analysis of the S&P 500 daily chart presents a clear view of the index’s current direction and what may lie ahead. The market is currently in a trending phase, with movements driven by impulsive behavior rather than corrective shifts.
The main focus is on Gray Wave 1, which is part of a larger wave pattern unfolding within Orange Wave 5. This shows the wave's position in the broader cycle. According to the analysis, Orange Wave 4 has likely ended, and the market is moving into Gray Wave 1 of 5.
This phase is expected to maintain an impulsive nature, pointing to strong upward momentum before a new trend forms. The next higher-degree wave to observe is Gray Wave 1, which has already started and is progressing. Traders should monitor this wave closely and prepare for potential continued gains. Understanding the wave structure is essential for anticipating price direction with greater accuracy.
This review of the daily chart provides a broad perspective, helping traders align their strategies with longer-term patterns and key market shifts. Recognizing wave transitions is critical for timely and informed trading decisions. This approach improves the ability to forecast market behavior and adapt strategies to current trends.
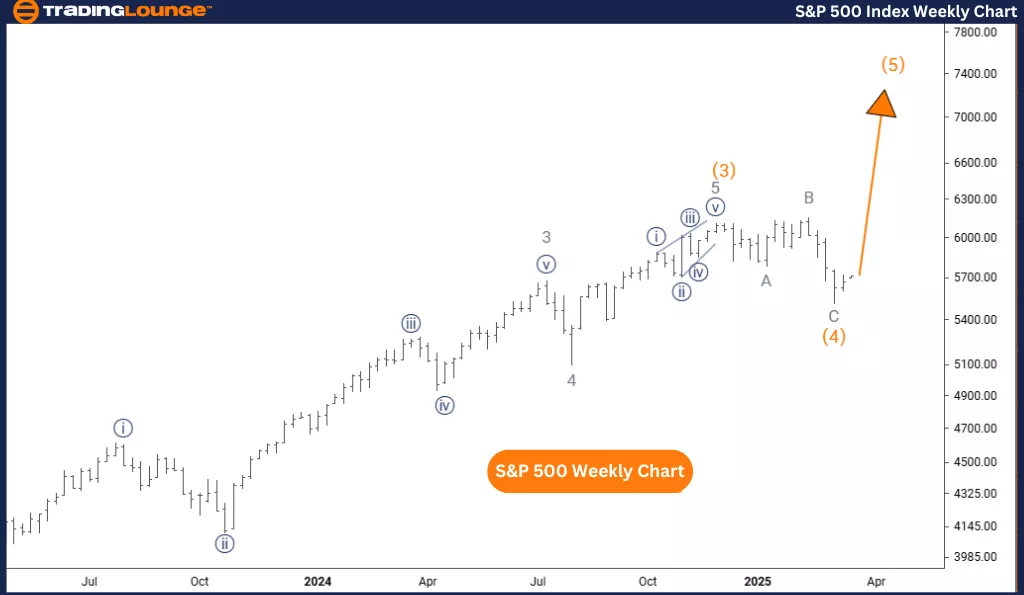
S&P 500 Elliott Wave Analysis – Weekly Chart
S&P 500 Elliott Wave Technical Analysis
FUNCTION: Trend
MODE: Impulsive
STRUCTURE: Orange Wave 5
POSITION: Navy Blue Wave 1
DIRECTION NEXT HIGHER DEGREES: Orange Wave 5 (Started)
DETAILS: Orange Wave 4 appears complete; Orange Wave 5 is now active.
The weekly Elliott Wave analysis for the S&P 500 delivers a complete view of the index’s long-term trend and potential future path. The market is currently showing trending behavior, driven by impulsive movements instead of corrective ones.
The key structure under analysis is Orange Wave 5, forming within Navy Blue Wave 1, revealing its placement in the broader wave count. Based on current observations, Orange Wave 4 seems to have ended, and Orange Wave 5 is now in motion.
This phase is expected to remain impulsive, pointing to continued upward movement before any significant trend change. The next wave to track is also Orange Wave 5, which has already started and is likely to progress further. Traders should closely follow the development of this wave to anticipate future moves. Understanding the wave layout helps in forecasting potential market direction more accurately.
This weekly chart perspective provides a solid foundation for understanding market structure and long-term trend evolution. It allows traders to align their strategies with broader market cycles and recognize turning points more effectively. Identifying the completion of one wave and the beginning of another helps refine trading plans and ensures better preparedness for changing conditions.
Technical Analyst: Malik Awais
More By This Author:
Elliott Wave Technical Analysis - Theta Token Crypto Price News
Elliott Wave Strategies For SP500, Nasdaq, And Tech Stocks Like Apple And Tesla.
Elliott Wave Technical Forecast: News Corporation
At TradingLounge™, we provide actionable Elliott Wave analysis across over 200 markets. Access live chat rooms, advanced AI & algorithmic charting tools, and curated trade ...
more

