
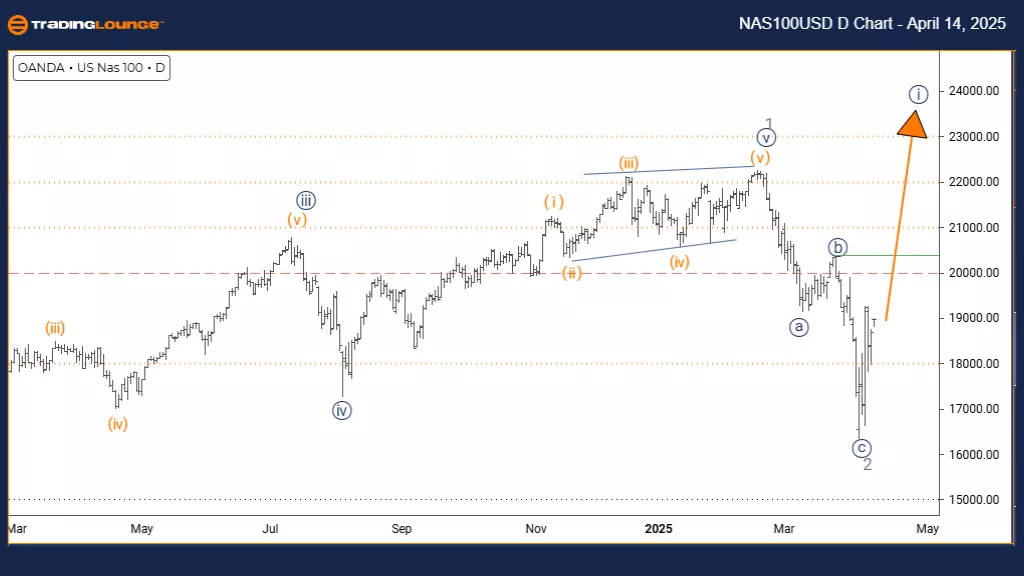
Nasdaq Elliott Wave Analysis – Trading Lounge Day Chart
Nasdaq Elliott Wave Technical Analysis
FUNCTION: Bullish Trend
MODE: Impulsive
STRUCTURE: Navy Blue Wave 1
POSITION: Gray Wave 3
DIRECTION NEXT LOWER DEGREES: Navy Blue Wave 2
DETAILS: Gray wave 2 appears completed; now navy blue wave 1 of 3 is in progress.
The Nasdaq daily chart is currently signaling a bullish trend through an impulsive Elliott Wave pattern. The index has completed the gray wave 2 correction and transitioned into navy blue wave 1, which is part of a broader gray wave 3 formation. This marks the early stages of a new upward impulse phase within a larger bullish structure on higher timeframes.
Navy blue wave 1 indicates the beginning of a five-wave impulse movement. While not typically the strongest wave in terms of momentum, wave 1 often defines the new directional path. The end of gray wave 2 correction has created the setup for this fresh upward movement. Based on current analysis, this upward momentum is expected to develop gradually, potentially laying the groundwork for stronger waves ahead.
Once navy blue wave 1 completes, traders can anticipate the formation of navy blue wave 2. This upcoming phase should be corrective and may present a pullback opportunity before the continuation into navy blue wave 3. Watch for signs of wave 1 nearing Fibonacci relationship zones, which could signal its end and the start of wave 2.
The daily timeframe provides insight into the emerging bullish sequence. This current impulse phase may not yet show peak strength, but it's an important step toward establishing upward momentum. Market watchers should look for early wave characteristics such as growing volume and steady upward price moves. It’s important to remember that wave 1 often builds a foundation without the explosive movement seen in wave 3.
This analysis suggests a favorable setup for bullish strategies while understanding the measured nature of wave 1’s progression. As the market moves deeper into the gray wave 3 cycle, stronger momentum is expected in upcoming waves. Monitoring momentum and price action will help confirm this wave count and support timely trading decisions.
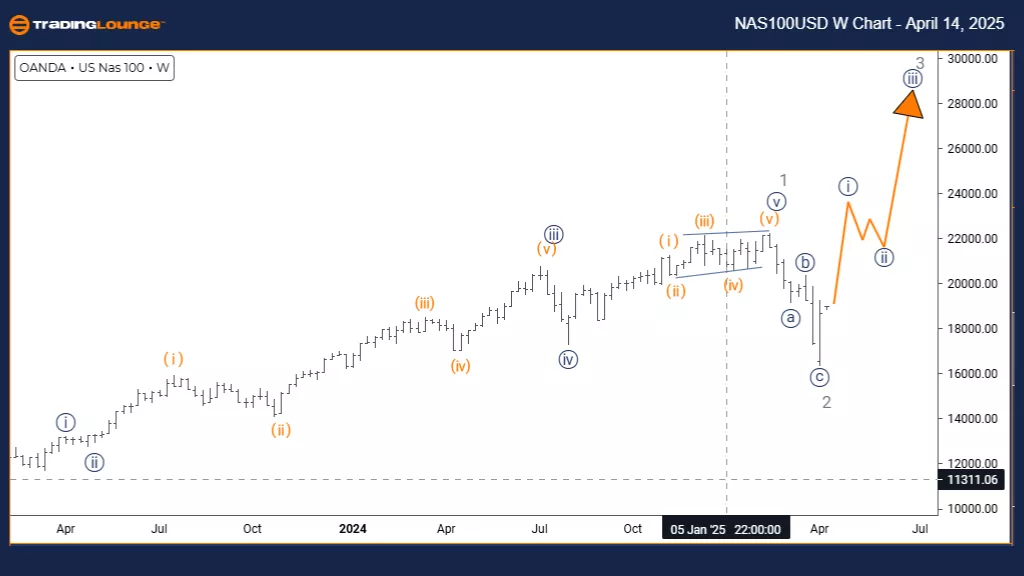
Nasdaq Elliott Wave Analysis – Trading Lounge Weekly Chart
Nasdaq Elliott Wave Technical Analysis
FUNCTION: Bullish Trend
MODE: Impulsive
STRUCTURE: Navy Blue Wave 1
POSITION: Gray Wave 3
DIRECTION NEXT LOWER DEGREES: Navy Blue Wave 2
DETAILS: Gray wave 2 appears completed; now navy blue wave 1 of 3 is unfolding.
The Nasdaq weekly chart analysis outlines a bullish trend developing under an impulsive Elliott Wave pattern. The index has completed the gray wave 2 correction and moved into navy blue wave 1, part of the larger gray wave 3 sequence. This suggests the beginning of a fresh upward impulse wave within a broader bullish structure on higher timeframe charts. The end of the gray wave 2 correction indicates the transition from a corrective phase to a new directional push upward.
Navy blue wave 1 is the starting point of this new impulse sequence and usually features building momentum as it sets the trend's course. While this wave might not be as forceful as wave 3, its progression confirms that the bullish momentum is returning. Current structural developments suggest that price advances may continue steadily, providing the groundwork for stronger future moves.
Once navy blue wave 1 completes, the market should transition into navy blue wave 2, expected to be a corrective phase. This pullback could provide a strategic opportunity before the stronger wave 3 continues the broader uptrend. The weekly timeframe offers a valuable look at the market’s early bullish phase and sets the context for longer-term upward movement.
Traders should watch navy blue wave 1 for consistent upward price action and increasing volume, typical of early impulse wave behavior. The shift into the higher-degree gray wave 3 points to possible sustained bullish activity, making this an ideal period for building long positions. Confirming indicators such as price action signals and technical momentum patterns will be key in validating this wave structure and identifying when wave 1 concludes, setting the stage for wave 2.
Technical Analyst: Malik Awais
More By This Author:
Elliott Wave Trading Strategies: SP500, Nasdaq & April Tech Earnings Insights
Elliott Wave Technical Forecast: Suncorp Group Limited
Elliott Wave Technical Analysis: Berkshire Hathaway Inc. - Friday, April 11


Comments
Log in or sign up to join the conversation.