
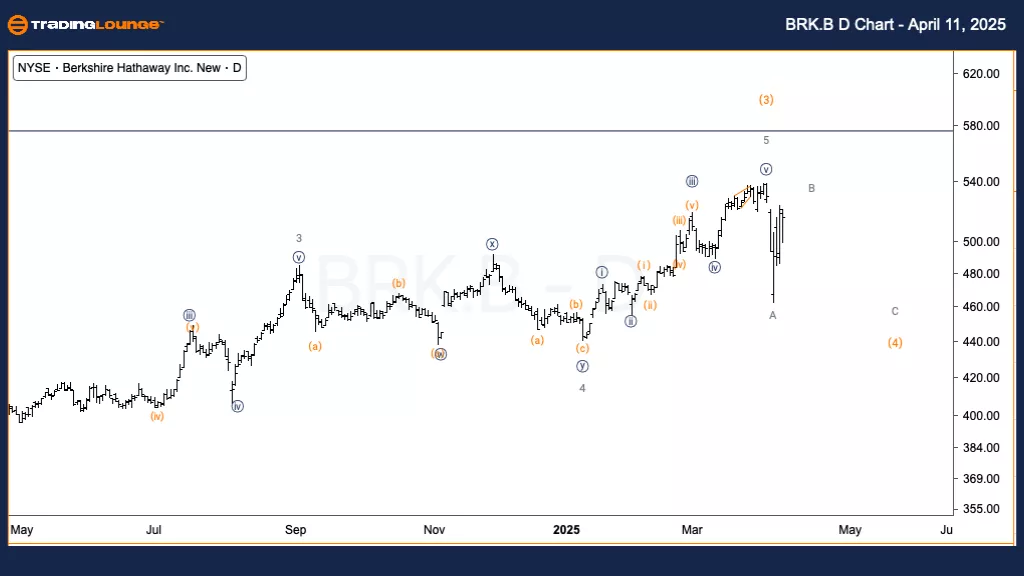
Berkshire Hathaway Inc. (BRK-B) – Daily Chart
Mode: Corrective
Structure: ZigZag
Position: Wave B of (4)
Details: The bounce seen in wave B, following the tariff suspension, is now interpreted as a corrective move, not impulsive. Watching for a top in wave B.
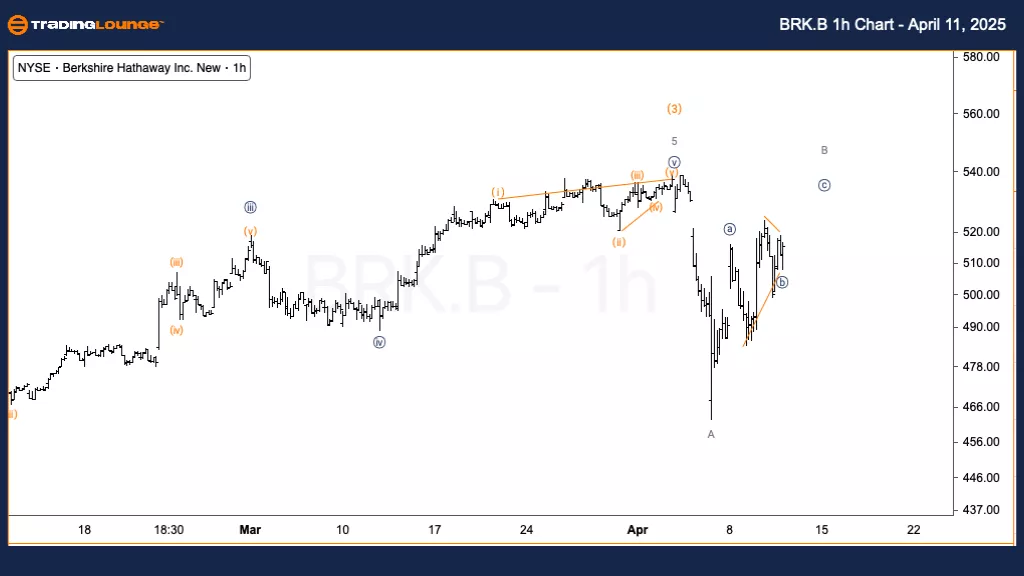
Berkshire Hathaway Inc. (BRK-B) – 1-Hour Chart
Mode: Corrective
Structure: ZigZag
Position: Wave {c} of B
Details: Possibly forming a triangle in wave {b}, leading to an upward extension in wave {c}. This structure supports the overall corrective count. Look for signs of reversal confirming the continuation of the correction.
Berkshire Hathaway (BRK-B) Elliott Wave Analysis – April 11, 2025
This article presents a detailed Elliott Wave analysis of Berkshire Hathaway Inc. (BRK-B) using both the Daily and 1-Hour Charts. The stock is currently moving through a corrective zigzag structure, with Wave B of (4) likely nearing its peak. The reaction to recent tariff news is viewed as corrective, not impulsive. On the 1-hour chart, a potential triangle formation within Wave {b} of B is unfolding, leading into Wave {c}. The analysis guides traders on what signals to watch for, to confirm the corrective structure and identify optimal timing for the next phase.
Technical Analyst: Alessio Barretta
More By This Author:
Elliott Wave Technical Analysis: S&P/TSX 60 Index - Friday, April 11
Elliott Wave Technical Analysis: Cardano Crypto Price News For Friday, April 11
Elliott Wave Analysis: Block, Inc.


Comments
Log in or sign up to join the conversation.