
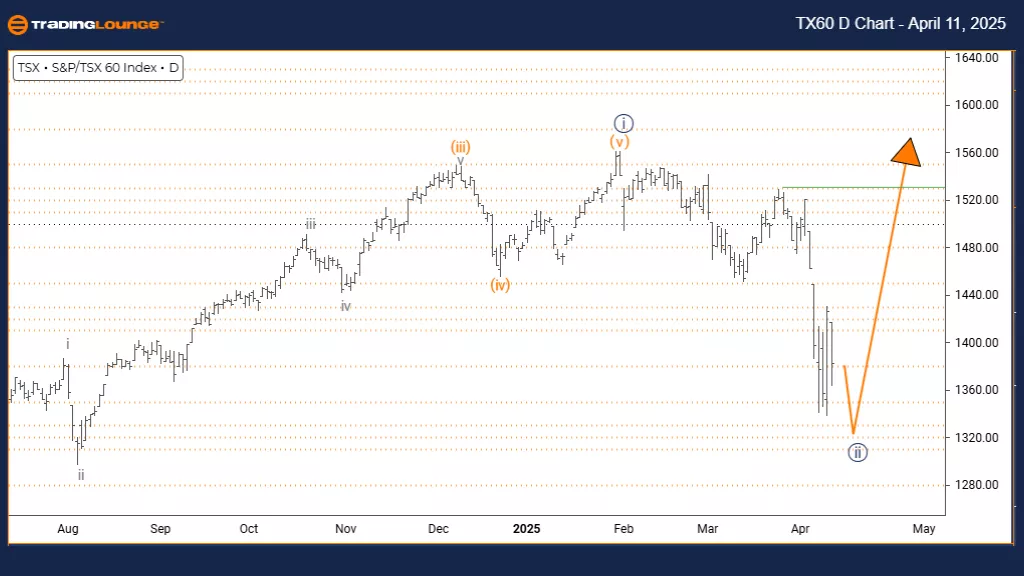
S&P/TSX 60 Elliott Wave Analysis – Trading Lounge Day Chart
S&P/TSX 60 – Daily Chart
S&P/TSX 60 Elliott Wave Technical Analysis
Function: Counter Trend
Mode: Corrective
Structure: Navy blue wave 2
Position: Gray wave 3
Direction (Next Higher Degrees): Navy blue wave 3
Details: Navy blue wave 1 seems completed; navy blue wave 2 is now active.
The daily chart for the S&P/TSX 60, interpreted via Elliott Wave theory, shows the index currently in a corrective counter-trend phase. The structure under focus is navy blue wave 2, part of a broader gray wave 3 impulsive formation.
The earlier navy blue wave 1 appears to have concluded, with current market behavior developing within wave 2. The next anticipated move is the emergence of wave 3, which generally aligns with the dominant upward trend and is often marked by strong, sustained momentum.
This setup suggests a likely bullish continuation following the end of wave 2. Traders should observe standard corrective patterns—zigzags, flats, or triangles—to determine the wave’s end. Spotting the transition from correction to impulse is crucial in validating this wave count.
Volume and momentum indicators will be key to confirming the start of wave 3, which typically delivers the most dynamic market action. The corrective phase currently presents an opportunity to prepare for a potential breakout move.
The Elliott Wave model provides a structured way to understand price direction. Staying focused on wave development, along with technical signals, will help traders align with market expectations. A breakout in navy blue wave 3 may present a strong upside trend.
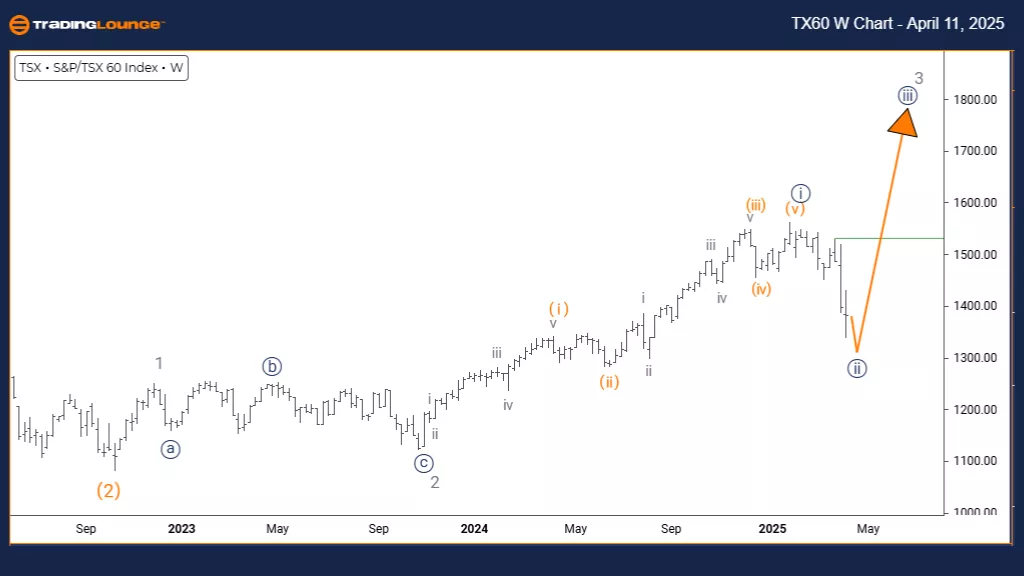
S&P/TSX 60 Elliott Wave Analysis – Trading Lounge Weekly Chart
S&P/TSX 60 – Weekly Chart
S&P/TSX 60 Elliott Wave Technical Analysis
Function: Counter Trend
Mode: Corrective
Structure: Navy blue wave 2
Position: Gray wave 3
Direction (Next Higher Degrees): Navy blue wave 3
Details: Navy blue wave 1 appears complete; navy blue wave 2 is now developing.
The weekly chart for the S&P/TSX 60, analyzed with Elliott Wave theory, highlights a counter-trend corrective phase currently in progress. The market structure has finalized navy blue wave 1, with navy blue wave 2 now forming within the larger gray wave 3 framework. This indicates a short-term pullback before the dominant uptrend resumes.
Wave 2 typically retraces part of wave 1’s progress. The current move is expected to follow a conventional Elliott Wave corrective pattern—like a zigzag, flat, or triangle—before transitioning into wave 3, which often delivers the most powerful market action in the sequence.
Traders should closely watch for the completion of wave 2, as this sets the stage for a potential strong upward move in wave 3. This shift from correction to impulse usually presents prime entry opportunities. Technical signals, such as volume behavior and momentum indicators, can aid in confirming this transition.
This corrective phase may represent a brief pause before a major bullish advance. Once wave 2 finishes, market direction could sharply align with wave 3’s path, offering substantial trend-following opportunities.
From a weekly perspective, this correction fits into the broader wave cycle and presents a key setup for the next impulsive phase. Close monitoring of wave patterns and confirmation tools will be essential for timing strategic positions.
Technical Analyst: Malik Awais
More By This Author:
Elliott Wave Technical Analysis: Cardano Crypto Price News For Friday, April 11
Elliott Wave Analysis: Block, Inc.
Elliott Wave Technical Analysis: CAC 40 - Thursday, April 10


Comments
Log in or sign up to join the conversation.