Elliott Wave Technical Analysis Lam Research Corp - Monday, August 14
Lam Research Corp., Elliott Wave Technical Analysis
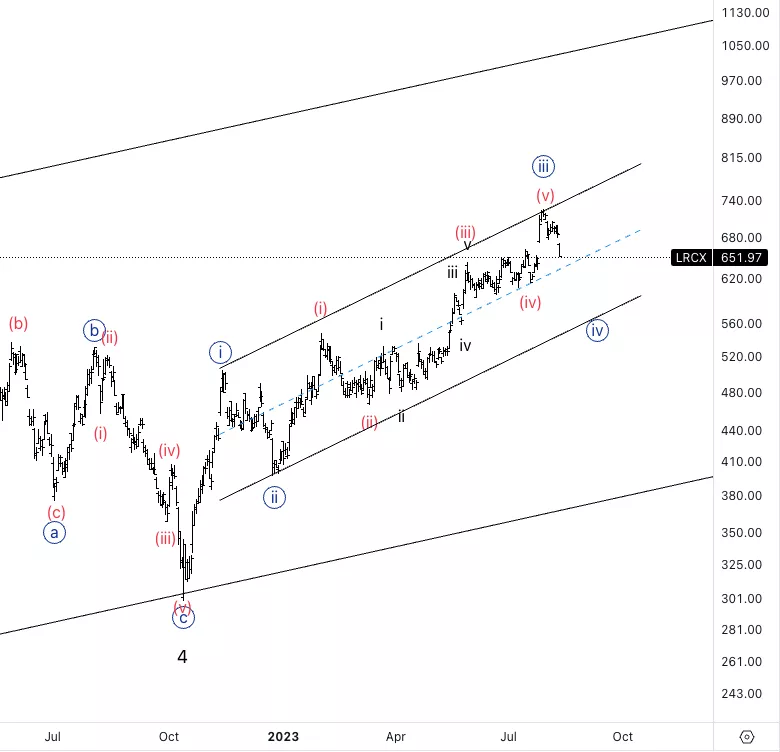
Lam Research Corp., (LRCX): Daily Chart 14 August 23
LRCX Stock Market Analysis: It looks like we anticipated the top of wave {iii} and we are already into the making of minute wave {iv}. Looking for additional downside into wave {iv} to then look for additional longs.
LRCX Elliott Wave Count: Wave {iv} of 1.
LRCX Technical Indicators: Below 20EMA.s
LRCX Trading Strategy: Looking for a bottom in wave {iv} to then look for longs.
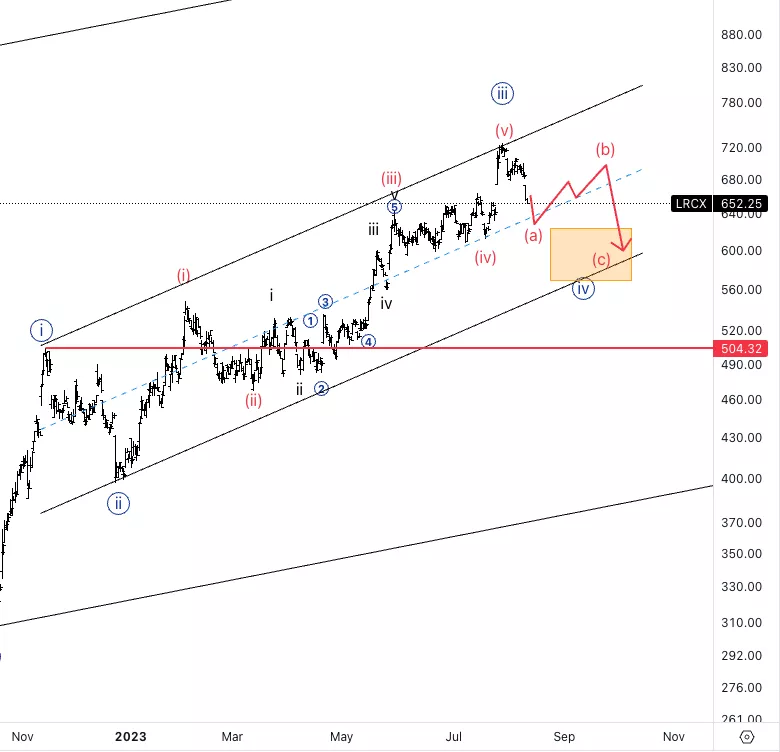
Lam Research Corp., LRCX: 4-hour Chart, 14 August 23
Lam Research Corp., Elliott Wave Technical Analysis
LRCX Stock Market Analysis: Looking for a three wave move into wave {iv} or else a sideways move such as a triangle. It looks like we are only in wave (a) of {iv}. Support is expected within the yellow box which represents 0.618 and equality of {iv} vs. {ii}.
LRCX Elliott Wave count: Wave (a) of {iv}
LRCX Technical Indicators: Below 20EMA.
LRCX Trading Strategy: Looking for additional confirmation we are in wave {iv}. Invalidaiton level stands at 504$.
(4Lam Research Corp., Elliott Wave Technical Analysis
Lam Research Corp., (LRCX:NASDAQ): Daily Chart 14 August 23
LRCX Stock Market Analysis: It looks like we anticipated the top of wave {iii} and we are already into the making of minute wave {iv}. Looking for additional downside into wave {iv} to then look for additional longs.
LRCX Elliott Wave Count: Wave {iv} of 1.
LRCX Technical Indicators: Below 20EMA.s
LRCX Trading Strategy: Looking for a bottom in wave {iv} to then look for longs.
(Click on image to enlarge)

Lam Research Corp., LRCX: 4-hour Chart, 14 August 23
Lam Research Corp., Elliott Wave Technical Analysis
LRCX Stock Market Analysis: Looking for a three wave move into wave {iv} or else a sideways move such as a triangle. It looks like we are only in wave (a) of {iv}. Support is expected within the yellow box which represents 0.618 and equality of {iv} vs. {ii}.
LRCX Elliott Wave count: Wave (a) of {iv}
LRCX Technical Indicators: Below 20EMA.
LRCX Trading Strategy: Looking for additional confirmation we are in wave {iv}. Invalidaiton level stands at 504$.

More By This Author:
Elliott Wave Technical Analysis: Vechain/U.S. Dollar - Monday, Aug. 14
Elliott Wave Technical Analysis Day Chart - Australian Dollar/U.S. Dollar
Elliott Wave Technical Analysis, 4 Hour Chart, Australian Dollar, Monday, Aug 14
Analyst Peter Mathers TradingLounge™ Australian Financial Services Licence - AFSL 317817


