

Image Source: Unsplash
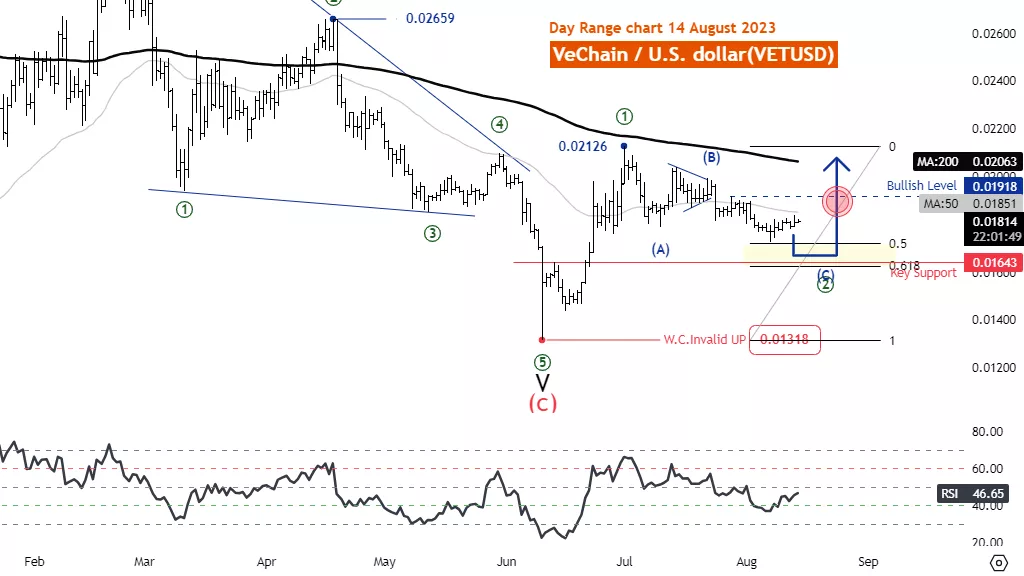
Elliott Wave Analysis TradingLounge Daily Chart, 14 August 2023
Vechain/U.S. Dollar(VETUSD) VETUSD
Elliott Wave Technical Analysis Function: Counter trend
Mode: Corrective
Structure: Zigzag
Position: Wave (B)
Direction Next higher
Degrees: wave ((2)) of Impulse Wave Cancel invalid Level: 0.01318
Details: Retracement of wave ((2)) usually .50 or .618 x Length wave ((1))
Vechain/U.S. Dollar(VETUSD)Trading Strategy: VeChain looks like the downtrend has ended at 0.01318 and is entering a new uptrend. With five waves extending in the upward direction. This leads us to predict the rise of wave ((1)), which is currently in the range of a correction in wave ((2)), with a Zigzag Retracement of wave ((2)) usually .50 or .618 x Length. wave ((1)), when wave ((2)) ends, the price has a chance to trade above the level of 0.02126.
Vechain/U.S. Dollar(VETUSD)Technical Indicators: The price is below the MA200 indicating a downtrend, RSI below 50 is Bearish momentum.
Analyst: Kittiampon Somboonsod, CEWA
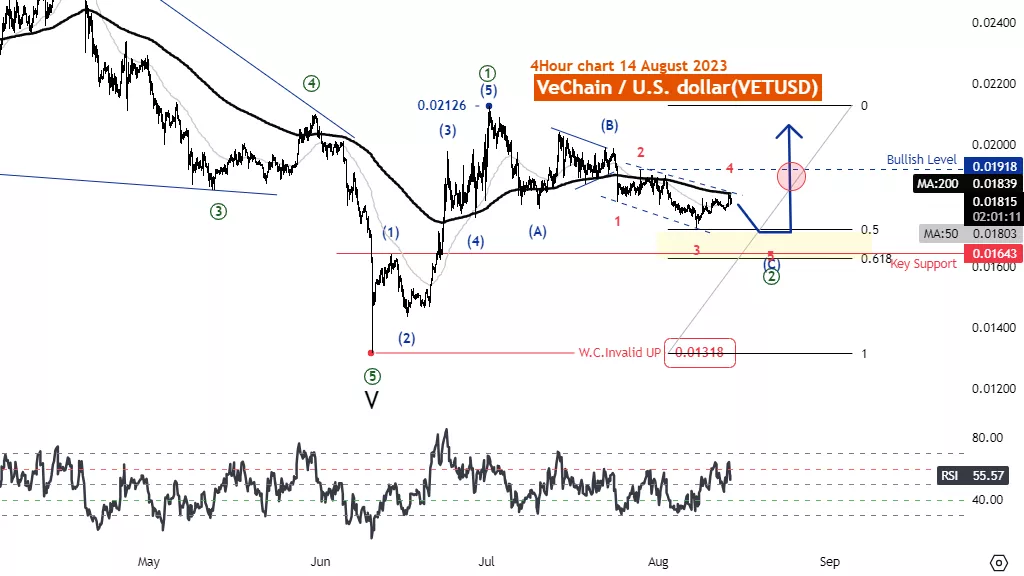
Elliott Wave Analysis TradingLounge 4H Chart, 14 August 2023
Vechain/U.S. Dollar(VETUSD) VETUSD
Elliott Wave Technical Analysis Function: Counter trend
Mode: Corrective
Structure: Zigzag
Position: Wave (B)
Direction Next higher
Degrees: wave ((2)) of Impulse
Wave Cancel invalid Level: 0.01318
Details: Retracement of wave ((2)) usually .50 or .618 x Length wave ((1))
Vechain/U.S. Dollar(VETUSD)Trading Strategy: VeChain looks like the downtrend has ended at 0.01318 and is entering a new uptrend. With five waves extending in an upward direction. This leads us to predict the rise of wave ((1)), which is currently in the range of a correction in wave ((2)), with a Zigzag Retracement of wave ((2)) usually .50 or .618 x Length. wave ((1)), when wave ((2)) ends, the price has a chance to trade above the level of 0.02126.
Vechain/U.S. Dollar(VETUSD)Technical Indicators: The price is below the MA200 indicating a downtrend, RSI below 50 is Bearish momentum.
More By This Author:
Tech Stock Report: AAPL, AMZN, NVDA, TSLA, GOOGL, META, NFLX, MSFT
Elliott Wave Technical Analysis: Texas Instruments Inc. - Friday, Aug. 11
Elliott Wave Technical Analysis: Spotify Inc. - Thursday, Aug. 10


Comments
Log in or sign up to join the conversation.