

Photo by Yiorgos Ntrahas on Unsplash
Spotify Inc., Elliott Wave Technical Analysis
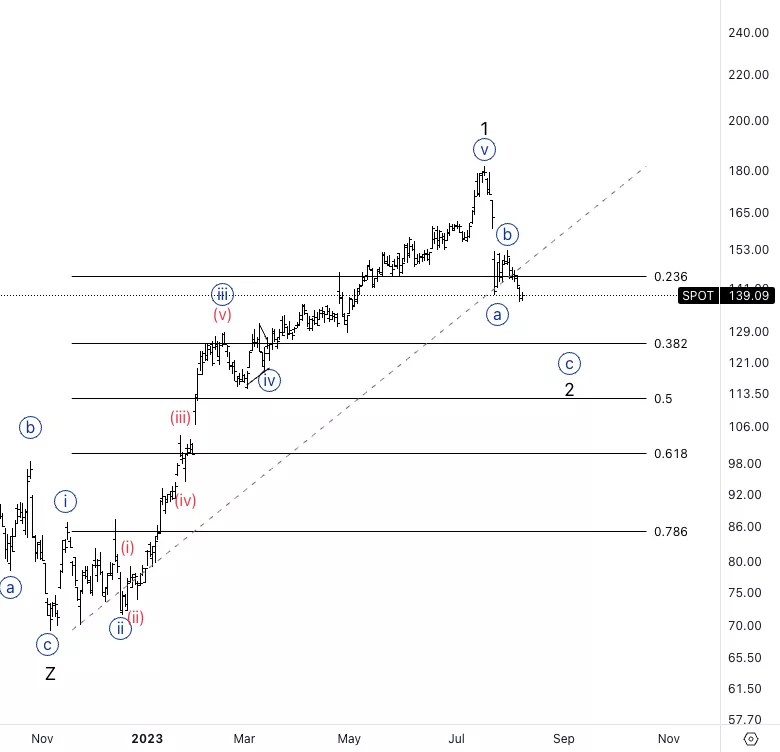
Spotify Inc., (NYSE: SPOT): Daily Chart, 10 August 2023
SPOT Stock Market Analysis: We’ve seen a large advanced to the upside into what seems to be either a wave. 1 or A. At this point we can look for a pullback into 2 or B.
SPOT Elliott Wave Count: Wave {c} of 2.
SPOT Technical Indicators: 200EMA as support.s
SPOT Trading Strategy: Looking for longs once we have a clear picture of the type of correction of potential wave 2 or B.
Analyst: Alessio Barretta
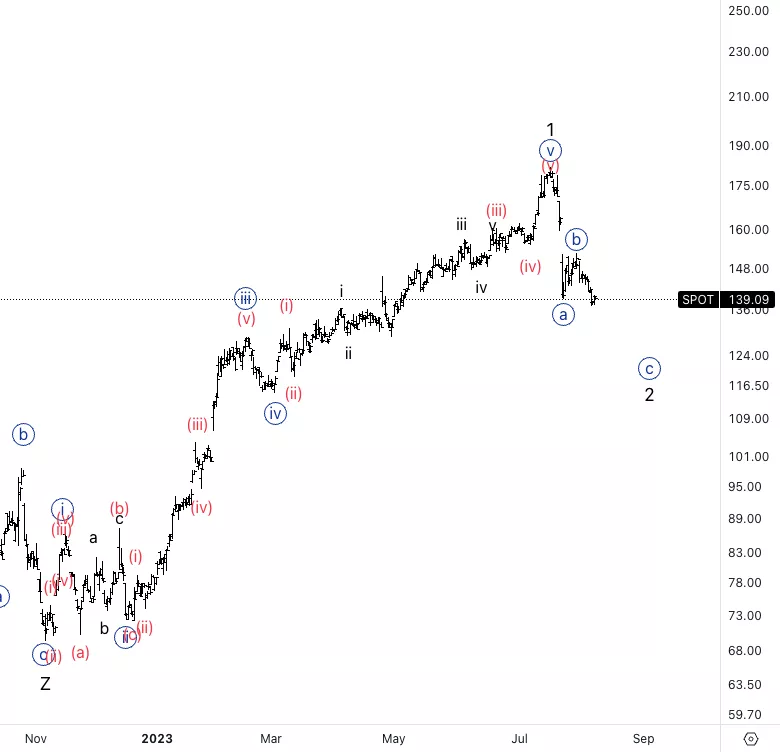
Spotify Inc., SPOT: 4-hour Chart, 10 August 2023
Spotify Inc., Elliott Wave Technical Analysis
SPOT Stock Market Analysis: We could either be in wave (c) of {a} or else in wve {c} of 2 as labelled. I would not be surprised to find a double correction lower. The area of support on the left is around the area of wave {iv}.
SPOT Elliott Wave count: Wave {c} of 2.
SPOT Technical Indicators: Below all averages.
SPOT Trading Strategy: Looking for longs once we have a clear picture of the type of correction of potential wave 2 or B.
More By This Author:
Elliott Wave Technical Analysis Day Chart: Australian Dollar/Japanese Yen
Elliott Wave Technical Analysis 4 Hour Chart: Australian Dollar/Japanese Yen
Bitcoin Support At $30,000 Signals Potential Upswing: Elliott Wave Analysis


Comments
Log in or sign up to join the conversation.