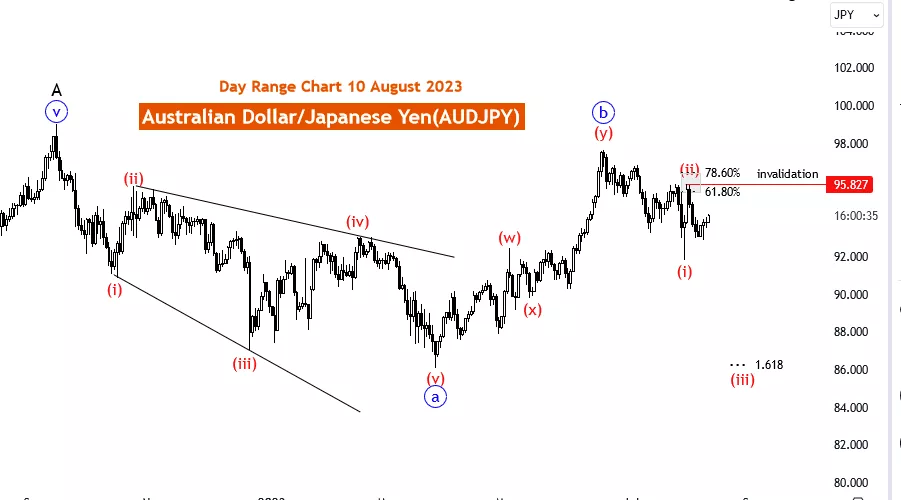
Elliott Wave Technical Analysis Day Chart: Australian Dollar/Japanese Yen
Image Source: Unsplash
AUDJPY Elliott Wave Analysis Trading Lounge Day Chart, 10 August 2023
Australian Dollar/Japanese Yen (AUDJPY) Day Chart
AUDJPY Elliott Wave Technical Analysis
Function: Higher Counter Trend
Mode: impulsive
Structure: 3 of C
Position: Blue wave C of B
Direction Next lower Degrees: wave (3) of Motive continue
Details: Red subwave 3 likely to end at the fib level 1.618. Wave Cancel invalid level:95.827
The Elliott Wave analysis of the day chart for the Australian Dollar / Japanese Yen (AUDJPY) pair on 10 August 23, indicates a higher counter-trend movement with an impulsive mode. The analysis delves into the structural intricacies of the price movement, revealing the third wave (3 of C) within the larger wave pattern.
The specific position of the price wave is designated as the Blue wave C of B, suggesting the development of a subwave within a broader wave pattern. This subwave is identified as wave (3) and is expected to persist as part of a motive wave pattern.
Of note is the projection that the ongoing Red subwave 3 is likely to conclude within the range of the Fibonacci retracement level of 1.618. Traders and market participants are advised to closely monitor the price movement, as the completion of this subwave could signify a pivotal juncture in the broader trend.
However, it is emphasized that the wave count provided would be invalidated should the AUDJPY price surpass the level of 95.827.
As of the specified date, traders focusing on the AUDJPY market should be attuned to the unfolding higher counter-trend movement and anticipate the culmination of the Red subwave 3. Engaging in impulsive trading strategies requires careful consideration and the implementation of effective risk management protocols.
Moreover, the analysis implies the potential continuation of the motive wave pattern after the completion of the subwave 3. Traders are advised to remain vigilant for further indications of impulsive movement and formulate trading strategies that align with the prevailing market trend.
While Elliott Wave analysis offers insights into potential market patterns and price movements, traders should complement it with other technical indicators and fundamental factors for a well-rounded trading strategy. Given the dynamic nature of market conditions influenced by factors like economic data releases, geopolitical events, and shifts in market sentiment, adaptability and vigilance are crucial.
Traders should implement robust risk management practices in their trading endeavors to safeguard capital and mitigate potential losses. By staying informed and adopting a comprehensive approach to trading, traders can make informed decisions and enhance their trading performance in the ever-evolving foreign exchange markets.

More By This Author:
Bitcoin Support At $30,000 Signals Potential Upswing: Elliott Wave Analysis
Elliott Wave Technical Analysis: Deere & Co. - Wednesday, August 9
Elliott Wave Technical Analysis: US Dollar/Swiss Franc - Wednesday, August 9
Analyst Peter Mathers TradingLounge™ Australian Financial Services Licence - AFSL 317817


