
Deere & Co., Elliott Wave Technical Analysis
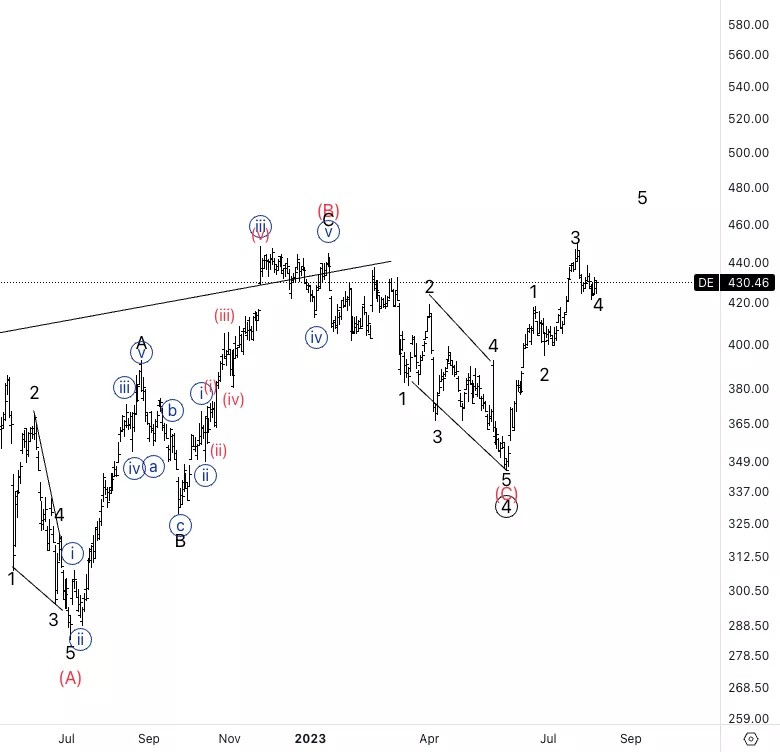
Deere & Co., (DE): Daily Chart 9 August 23
DE Stock Market Analysis: Looking for upside into potential wave (1) as we could have completed the overall correction into wave 4 of Primary degree.
DE Elliott Wave Count: Wave 4 of (1).
DE Technical Indicators: 20EMA as support.s
DE Trading Strategy: Looking for longs into wave 5 which must be shorter than 3.
(Click on image to enlarge)
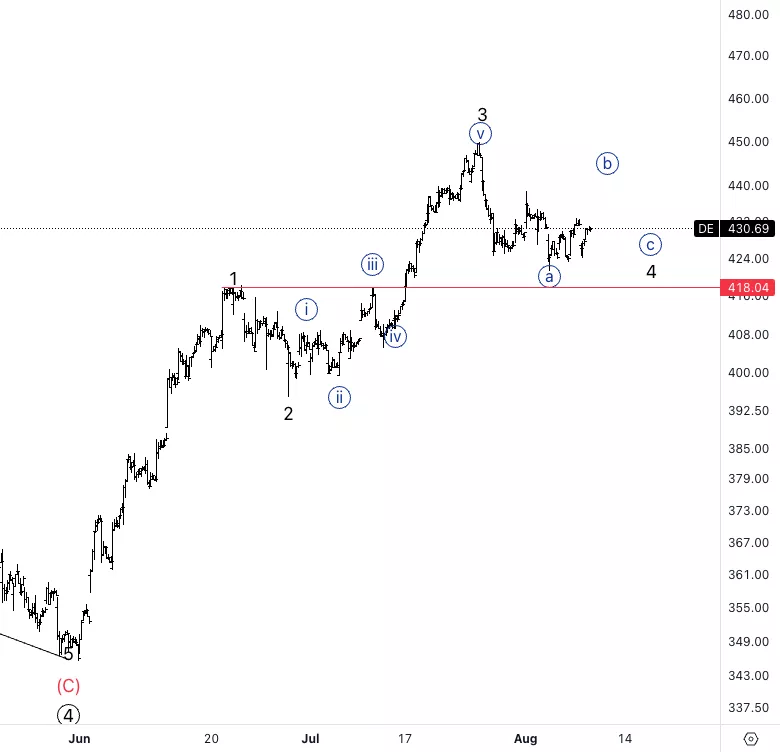
Deere & Co., DE: 4-hour Chart 9 August 23
Deere & Co., Elliott Wave Technical Analysis
DE Stock Market Analysis: We can identify five waves into wave 3 with an extended wave {v}. Looking for a sideways wave 4 to then resume higher
DE Elliott Wave count: Wave {b} of 4.
DE Technical Indicators: Above all averages.
DE Trading Strategy: Looking for longs with a stop at 418$.
(Click on image to enlarge)
More By This Author:
Elliott Wave Technical Analysis: Ethereum/U.S. Dollar - Wednesday, Aug. 9
Elliott Wave Technical Analysis: Monster Beverage, Tuesday, Aug. 8
Elliott Wave Technical Analysis: AAVE Token/U.S. Dollar Aug, 8


Comments
Log in or sign up to join the conversation.