

Image Source: Pixabay
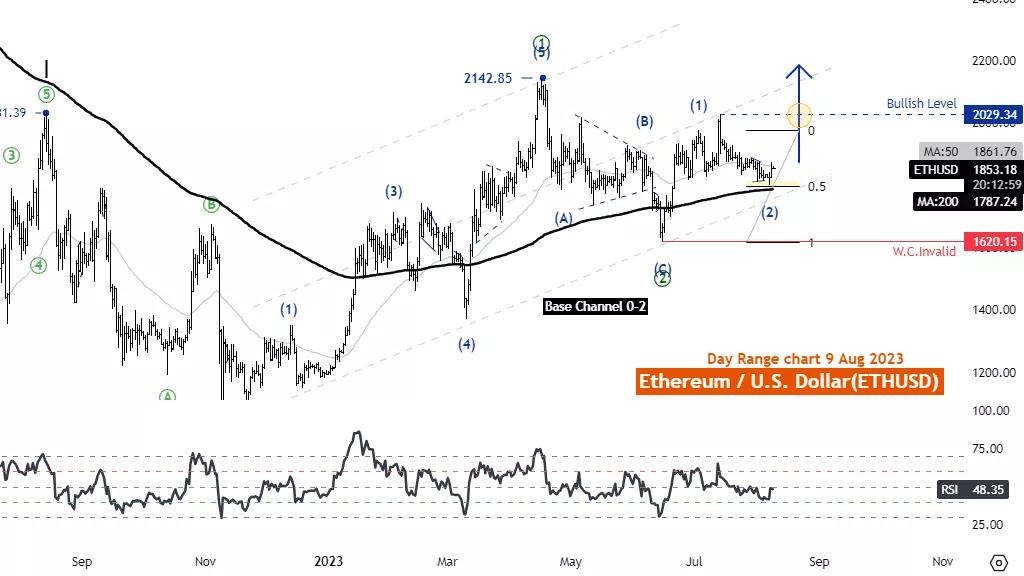
Elliott Wave Analysis TradingLounge Daily Chart, 9 August 2023.
Ethereum/U.S. Dollar(ETHUSD)
ETHUSD Elliott Wave Technical Analysis
Function: Reactionary(Counter Trend)
Mode: Corrective
Structure: Zigzag
Position: Wave (C)
Direction Next higher Degrees: wave ((2)) of Motive
Details: Retracement of wave ((2)) usually .50 or .618 x Length wave ((1))
Wave Cancel invalid level: 1620.15
Ethereum/U.S. Dollar(ETHUSD) Trading Strategy: Ethereum's main trend remains bullish As the price can expand five waves in an upward direction. Also, the price is above the MA200, showing a clear uptrend. Currently, the price is in the range of correction in wave (2) blue, which is a sub-wave of wave ((3)) on a larger scale. It is possible to retrace around the MA200 line, when wave (2) completes we expect to trade above the 2142.85 level. From here one may have to look for a five-wave structure on a smaller timeframe to confirm the idea.
Ethereum/U.S. Dollar(ETHUSD) Technical Indicators: The price is above the MA200 indicating an Uptrend, RSI below 50 is bearish momentum.
Analyst: Kittiampon Somboonsod, CEWA
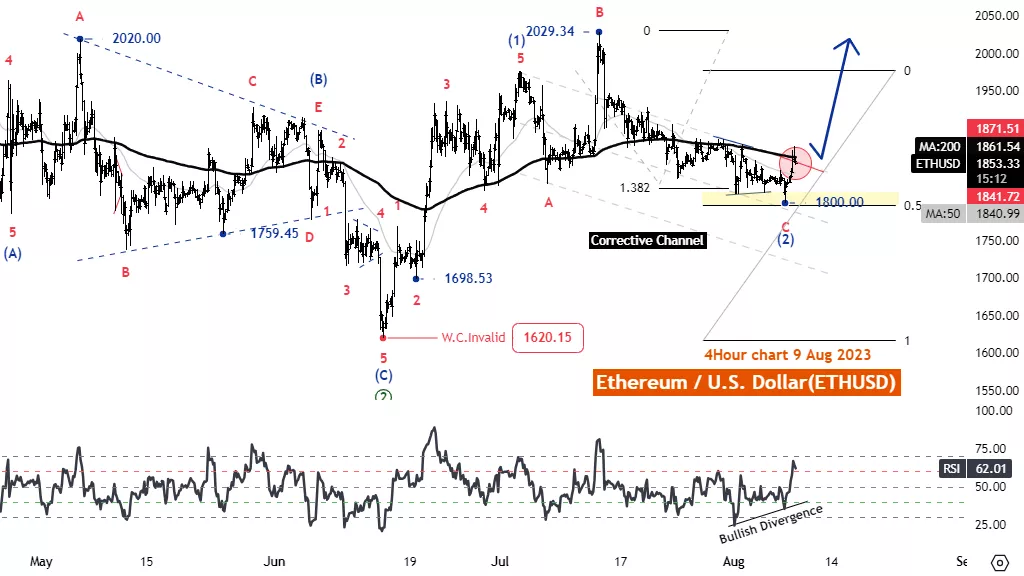
Elliott Wave Analysis TradingLounge 4H Chart, 9 August 2023.
Ethereum/U.S. Dollar(ETHUSD)
ETHUSD Elliott Wave Technical Analysis
Function: Reactionary(Counter Trend)
Mode: Corrective
Structure: Zigzag
Position: Wave (C)
Direction Next higher Degrees: wave ((2)) of Motive
Details: We are considering ending wave ((2)) from rising above 1886.80 level.
Wave Cancel invalid level: 1620.15
Ethereum/U.S. Dollar(ETHUSD) Trading Strategy: Ethereum's main trend remains bullish As the price can extend five waves in an upward direction, the price is currently in the retracement phase with a flat pattern in wave (2) blue, which is a subwave of wave ((3)) on a larger scale. It is possible to retrace around the 50% Fibo level of wave (1). Once wave (2) completes, we expect to trade above it. 2029.34 Trading considerations May have to wait for the price to be above the MA200 line first.
Ethereum/U.S. Dollar(ETHUSD) Technical Indicators: The price is below the MA200 indicating a Downtrend, RSI above 50 has a bullish divergence.
More By This Author:
Elliott Wave Technical Analysis: Monster Beverage, Tuesday, Aug. 8
Elliott Wave Technical Analysis: AAVE Token/U.S. Dollar Aug, 8
Elliott Wave Technical Analysis Day Chart: New Zealand Dollar/U.S. Dollar


Comments
Log in or sign up to join the conversation.