

Image Source: Pexels
AUDUSD Elliott Wave Analysis Trading Lounge Day Chart, 14 August 2023
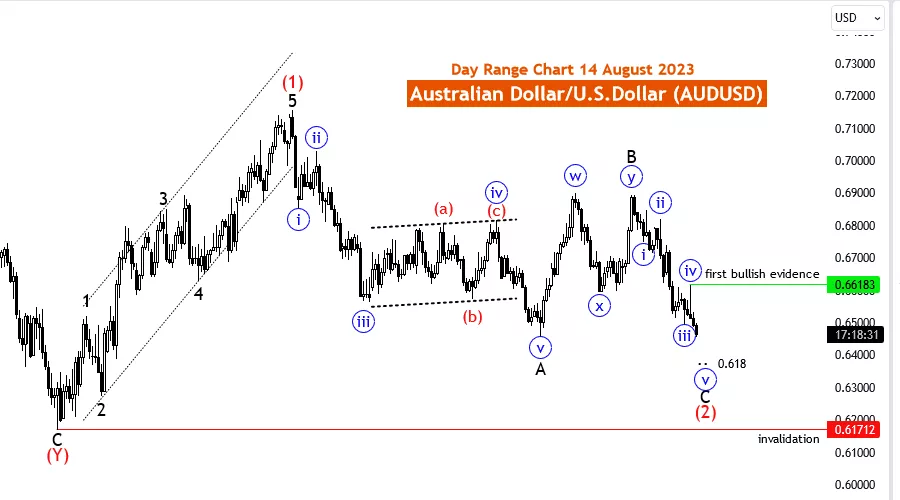
Australian Dollar/U.S.Dollar (AUDUSD) Day Chart
AUDUSD Elliott Wave Technical Analysis
Function: Counter Trend
Mode: impulsive
Structure: Blue wave 5 of C
Position: Black wave C Red wave 2
Direction Next Higher Degrees: After blue wave(5 of C of 2)new uptrend expected
Details: Blue Wave “5” likely end above 0.61712. Looking for Uptrend first evidence at 0.66183
The AUDUSD Elliott Wave analysis on 14 August 23, focuses on the day chart, providing insights into the counter-trend dynamics of the Australian Dollar to U.S. Dollar currency pair (AUDUSD). Employing impulsive characteristics within a counter-trend mode, the analysis particularly examines the structural aspects of the market movement, highlighting the significance of Blue wave 5 of C.
In this context, the analysis underscores the presence of a Blue wave 5 of C, positioned as Black wave C within the broader wave structure of Red wave 2. This alignment of waves reflects the complexity of the market movement, where different degrees of waves interact to create a comprehensive picture of the price trajectory.
The primary function of the market movement is identified as counter-trend, indicating that the current price dynamics are running contrary to the prevailing trend. Impulsive traits further define the nature of the movement, suggesting rapid and substantial price fluctuations that can provide potential trading opportunities for skilled traders.
A notable aspect of the analysis is the recognition of the expected endpoint of Blue Wave "5." The projection is that this wave is likely to conclude above the level of 0.61712. This forecasted endpoint can serve as a pivotal reference point for traders to evaluate potential price reversals and shifts in market sentiment.
Furthermore, the analysis highlights a crucial level for traders to monitor - 0.66183. This level is identified as the potential first evidence of an upcoming uptrend. As such, traders are advised to observe price movements around this level for indications of a broader market shift.
In conclusion, the day chart Elliott Wave analysis of the AUDUSD currency pair reveals the intricate interplay of waves and trends in the forex market. While Elliott Wave analysis offers valuable insights, it's essential to incorporate a multi-faceted trading strategy that considers technical, fundamental, and sentiment analysis. Additionally, prudent risk management strategies should be employed to navigate the inherent volatility of the forex market effectively.
Traders seeking to capitalize on counter-trend impulsive movements should stay attuned to market developments, refine their analysis techniques, and adapt their strategies as needed. By embracing a comprehensive approach to trading, traders can enhance their decision-making process and increase the likelihood of success in the ever-changing forex landscape.
More By This Author:
Tech Stock Report: AAPL, AMZN, NVDA, TSLA, GOOGL, META, NFLX, MSFT
Elliott Wave Technical Analysis: Texas Instruments Inc. - Friday, Aug. 11
Elliott Wave Technical Analysis: Spotify Inc. - Thursday, Aug. 10


Comments
Log in or sign up to join the conversation.