
Intuit Inc., Elliott Wave Technical Analysis
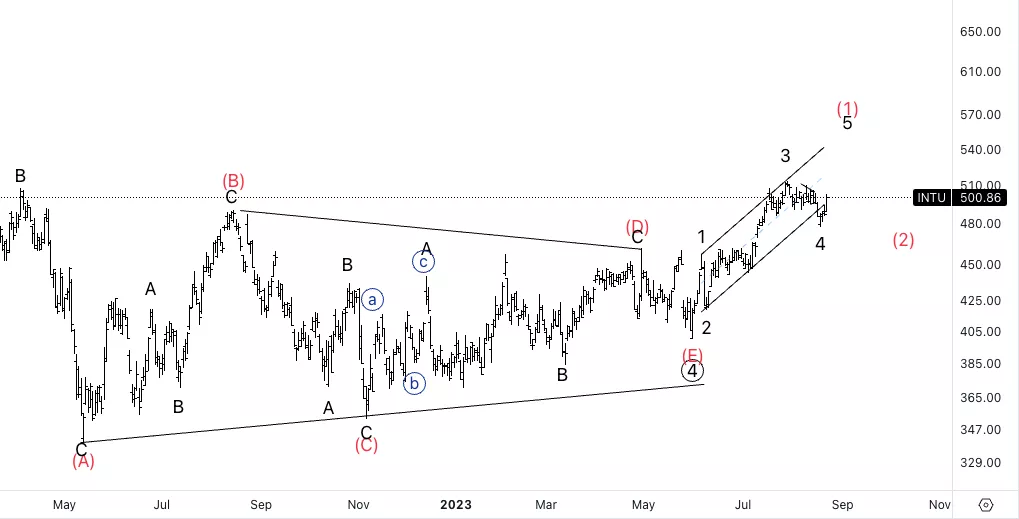
Intuit Inc., (INTU): Daily Chart, 24 August 23
INTU Stock Market Analysis: We have been looking for upside ever since the end of the trianle in primary wave 4. Looking for continuation higher into the last leg up to then complete a higher degree wave (1).
INTU Elliott Wave Count: Wave 5 of (1).
INTU Technical Indicators: Above all averages.
INTU Trading Strategy: Looking for longs within wave 5.
(Click on image to enlarge)
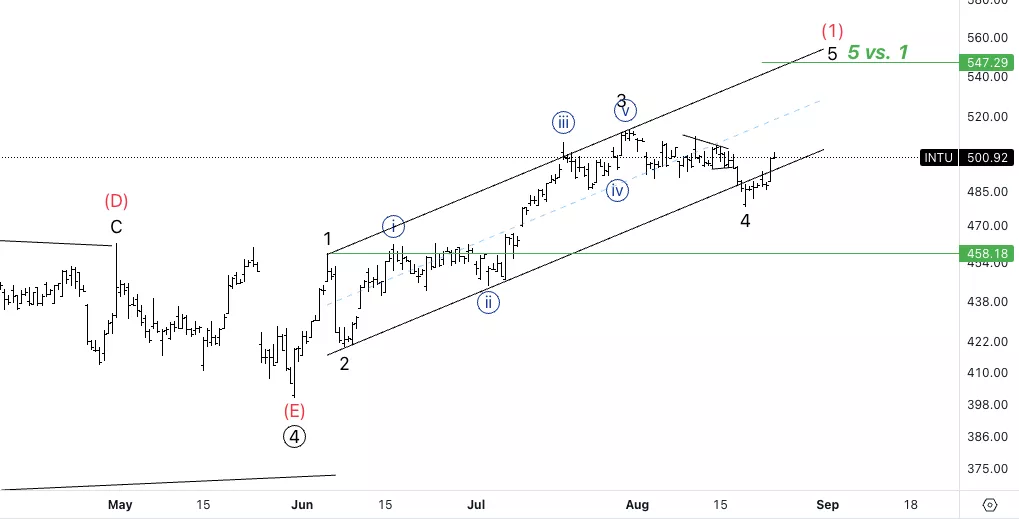
Intuit Inc., INTU: 4-hour Chart 24 August 23
Intuit Inc., Elliott Wave Technical Analysis
INTU Stock Market Analysis: Looking for upside into wave 5, we can see we came back within the base channel and ideally we will retest it and find support on it.
INTU Elliott Wave count: Wave {i} of 5.
INTU Technical Indicators: Above all averages.
INTU Trading Strategy: Looking for longs into wave 5 with invalidation at 458$ and upside target at 547$.
(Click on image to enlarge)
More By This Author:
Elliott Wave Technical Analysis Day Chart: U.S. Dollar/Swiss Franc
Elliott Wave Technical Analysis: AAVE/U.S. Dollar - Thursday, Aug. 24
Elliott Wave Technical Analysis: DexCom Inc. - Wednesday, Aug. 23


Comments
Log in or sign up to join the conversation.