

Image Source: Unsplash
DexCom Inc., Elliott Wave Technical Analysis
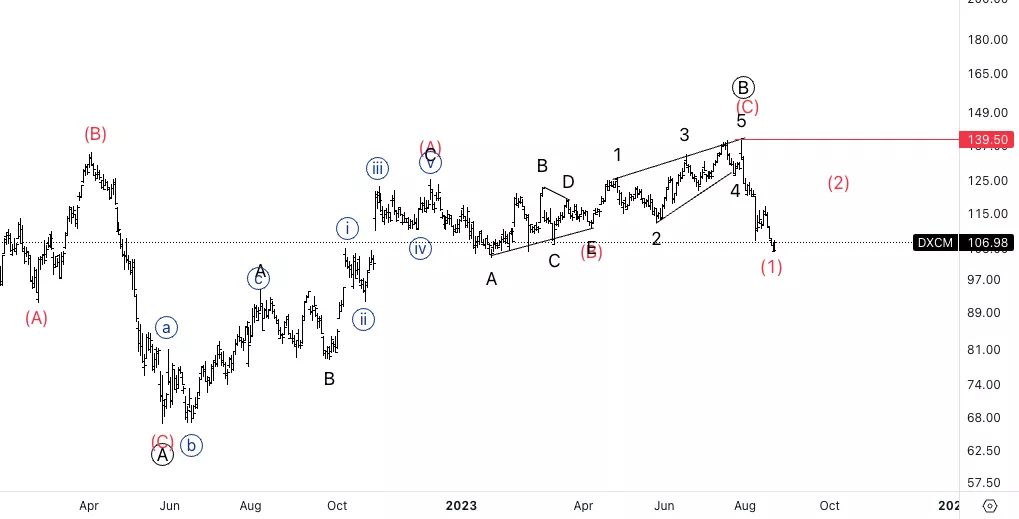
DexCom Inc., (Nasdaq: DXCM): Daily Chart 23 August 2023
DXCM Stock Market Analysis: WE have successfully moved lower ever since we identified the ending diagonal in wave (C) of primary B. We remain bearish as the price suggest it’s missing one more leg to the downside into primary wave C.
DXCM Elliott Wave Count: Wave (1) of C.
DXCM Technical Indicators: 20 and 200EMA crossing(usually a bearish sign).
DXCM Trading Strategy: Looking for shorts after a pullback in wave (2).
Analyst: Alessio Barretta
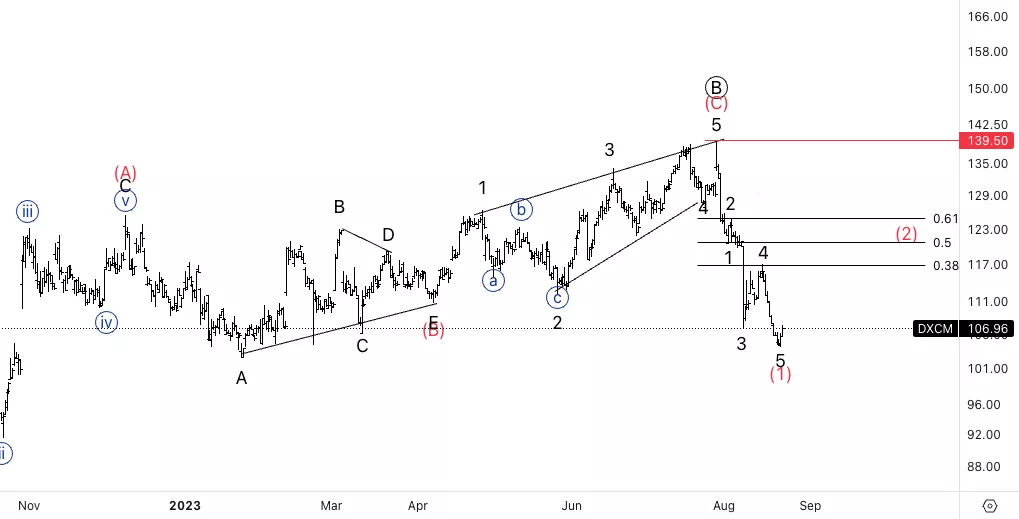
DexCom Inc., DXCM: 4-hour Chart, 23 August 2023
DexCom Inc., Elliott Wave Technical Analysis
DXCM Stock Market Analysis: We can identify a potential five wave move into wave (1). Looking for a pullback into wave (2) as we also have reached support at 100$.
DXCM Elliott Wave count: Wave 5 of (1).
DXCM Technical Indicators: Below all averages
DXCM Trading Strategy: Looking for upside into wave (2) to begin soon, to then look for shorts with invalidation at 139.5$
More By This Author:
Elliott Wave Technical Analysis: Binance Coin/U.S. Dollar
Elliott Wave Technical Analysis: Zscaler Inc. - Tuesday, Aug. 22
Elliott Wave Technical Analysis Day Chart: British Pound/U.S. Dollar


Comments
Log in or sign up to join the conversation.