

Image Source: Pixabay
Zscaler Inc., Elliott Wave Technical Analysis
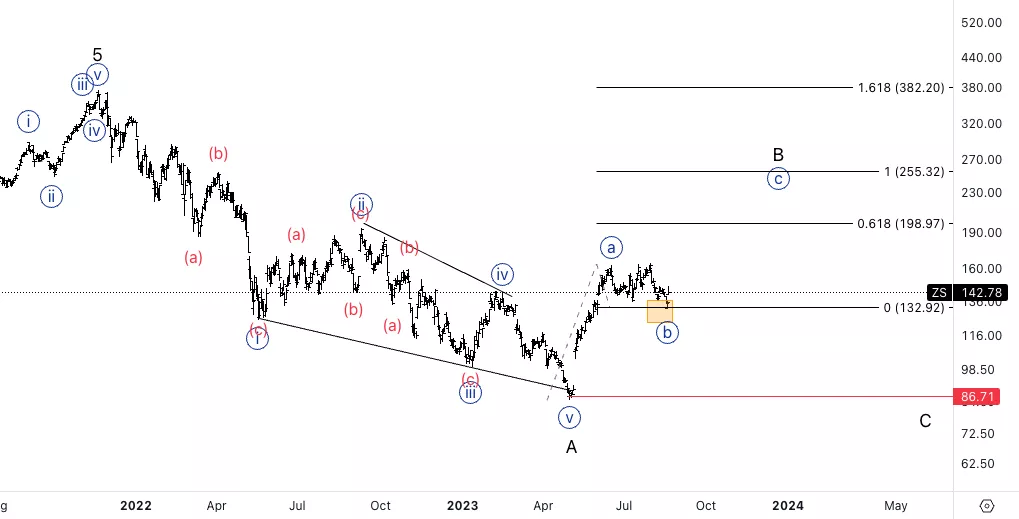
Zscaler Inc., (Nasdaq: ZS): Daily Chart, 22 August 2023
ZS Stock Market Analysis: We have been looking for further upside on Zscaler ever since we had the initial move up into potential wave {a}. Looking for continuation higher as we seem to be supported by the 130$.
ZS Elliott Wave Count: Wave {b} of B.
ZS Technical Indicators: 200EMa as support.
ZS Trading Strategy: Looking for longs after a break of wave (x) of {b} for additional confirmation.
Analyst: Alessio Barretta
Zscaler Inc., ZS: 1-hour Chart, 22 August 2023
Zscaler Inc., Elliott Wave Technical Analysis
ZS Stock Market Analysis: We have seen a sharp move higher which could signify we ended wave {b}. Looking for a break of wave (x) in order to have confirmation. Invalidation stands at 85$, but also a move below 132$ could start to compromise the count.
ZS Elliott Wave count: Wave i of (i).
ZS Technical Indicators: In between averages.
ZS Trading Strategy: Looking for upside into wave {c}, with an additional upside target of at least 200$.
More By This Author:
Global Stock Indices - Elliott Wave Technical Analysis
Elliott Wave Technical Analysis Day Chart: Australian Dollar/Japanese Yen - Monday, Aug. 21
Elliott Wave Technical Analysis 4 Hour Chart: Australian Dollar/Japanese Yen - Monday, Aug. 21


Comments
Log in or sign up to join the conversation.