

Image Source: Pixabay
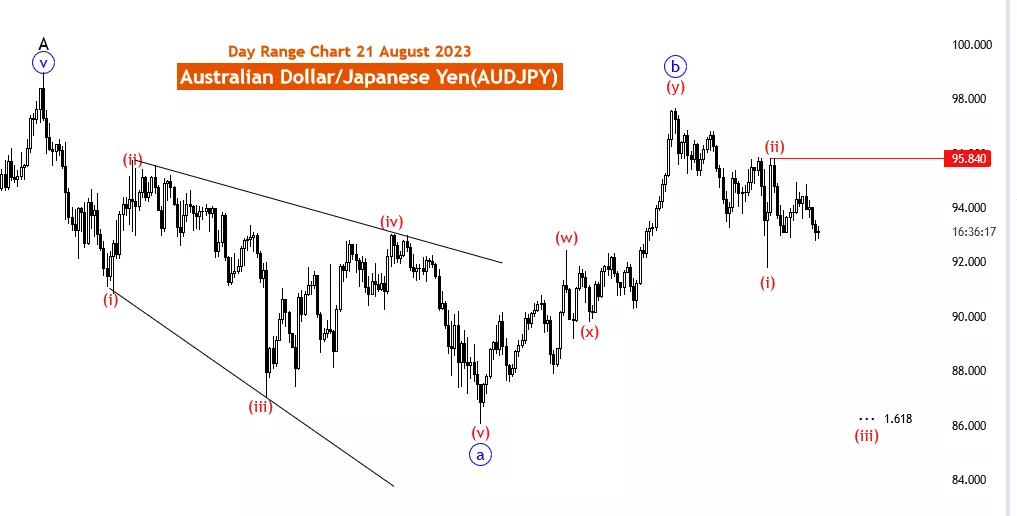
AUDJPY Elliott Wave Analysis Trading Lounge Day Chart, 21 August 2023.
Australian Dollar / Japanese Yen(AUDJPY) Day Chart
AUDJPY Elliott Wave Technical Analysis
Function: Counter Trend
Mode: impulsive
Structure: 3 of red wave 3
Position: Red wave 3 of C
Direction Next lower Degrees: wave (3 of 3) of Motive continue
Details: After corrective wave 2,Now Wave 3 of 3 is in play. Wave 3 is likely to end at fib level 1.618. Wave Cancel invalid level:95.840
The AUDJPY Elliott Wave analysis for August 21, 2023, focuses on the daily chart, providing valuable insights into a counter-trend impulsive movement within the context of red wave 3. This analysis holds significance for traders aiming to capitalize on short-term market dynamics and make informed trading decisions.
Counter-trend impulsive movements are pivotal as they often lead to substantial price changes that defy the predominant market trend. Recognizing and interpreting these movements can empower traders to seize potential opportunities amidst market fluctuations.
Central to this analysis is the emphasis on the third wave within the framework of red wave 3, as represented by the position of red wave 3 of C. This phase signifies an impulsive movement characterized by pronounced price shifts, offering traders opportunities to explore short-term trading prospects.
The analysis highlights the completion of the corrective wave 2, indicating its conclusion after which Wave 3 of 3 has commenced. This transition from a corrective phase to an impulsive one is a significant signal for traders, potentially leading to notable price movements.
Traders are advised to closely monitor the progression of Wave 3 of 3, which is currently underway. This wave represents a continuation of impulsive behavior, implying further price movement in the same direction. Remaining attuned to these developments is key for traders seeking to devise effective strategies to optimize short-term trading outcomes.
Moreover, the analysis specifies that Wave 3 is projected to conclude near the fib level 1.618. This level acts as a potential target for the ongoing wave, aiding traders in setting realistic profit objectives and assessing the effectiveness of their trading strategies.
The Wave Cancel invalid level at 95.840 serves as a critical threshold, and traders are encouraged to consider its breach as it could prompt reevaluation of the current wave analysis and necessitate adjustments in trading strategies and risk management.
To sum up, the AUDJPY Elliott Wave analysis for 21 August 23, underscores the importance of counter-trend impulsive movements within the context of red wave 3. By interpreting these patterns, traders can navigate short-term market volatility, exploit opportunities during impulsive phases, and make well-informed trading decisions. While this analysis provides valuable insights, it's prudent for traders to supplement it with other market data, fundamental analysis, and sentiment indicators to ensure a comprehensive trading approach.
Analyst: Malik Awais
More By This Author:
Elliott Wave Technical Analysis: Lam Research Corp. - Friday, Aug. 18
Elliott Wave Technical Analysis: US Dollar/Canadian 4 Hour Chart USD/CAD Friday, August 18
Elliott Wave Technical Analysis: Dogecoin/U.S. Dollar - Friday, Aug. 18


Comments
Log in or sign up to join the conversation.