Elliott Wave Technical Analysis: Lam Research Corp. - Friday, Aug. 18
Image Source: Unsplash
Lam Research Corp., Elliott Wave Technical Analysis
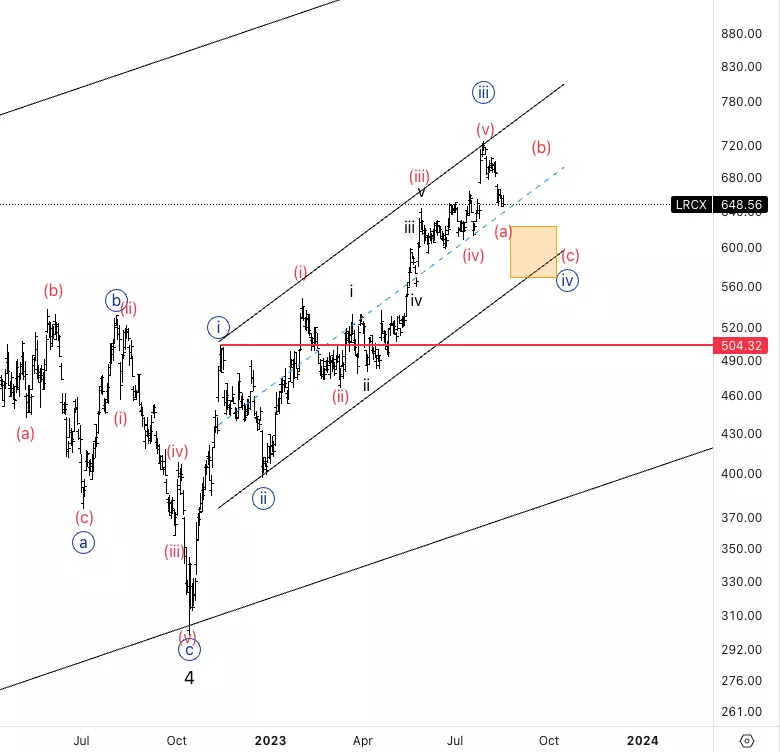
Lam Research Corp., (Nasdaq: LRCX): Daily Chart, 18 August 2023
LRCX Stock Market Analysis: Looking for further downside into wave {iv}, to find support on the base Elliott channel. Invalidation level stands at 504$.
LRCX Elliott Wave Count: Wave (a) of {iv}.
LRCX Technical Indicators: Below 20EMA.
LRCX Trading Strategy: Looking for additional downside before considering longs. We could also be looking for shorts once we complete wave (b).
Analyst: Alessio Barretta

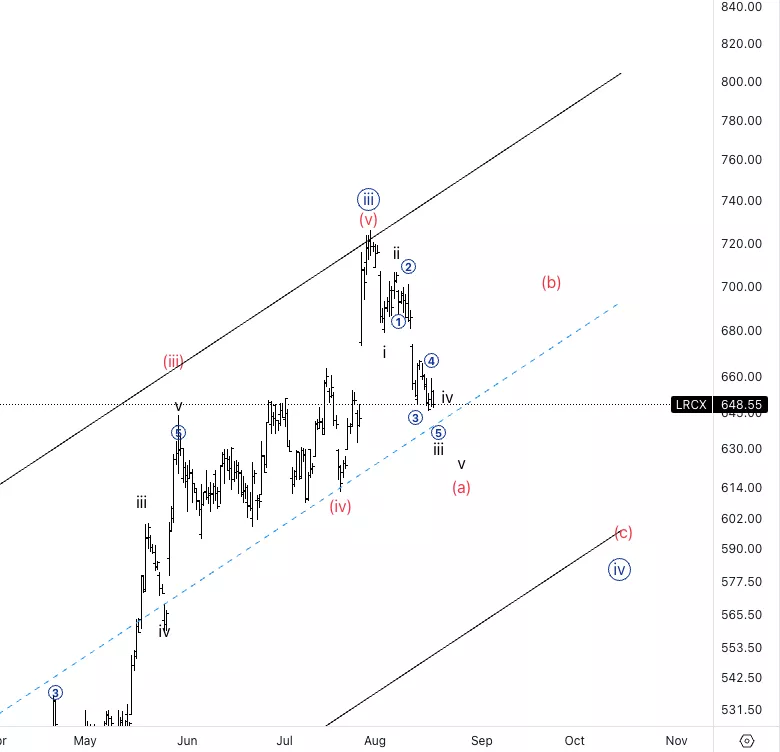
Lam Research Corp., LRCX: 4-hour Chart, 18 August 2023
Lam Research Corp., Elliott Wave Technical Analysis
LRCX Stock Market Analysis: It looks like we are unfolding into a five wave move in wave (a). Looking for support between 630$ and 600$ to then bounce into wave (b).
LRCX Elliott Wave count: Wave iii of (a).
LRCX Technical Indicators: Below 20EMA.
LRCX Trading Strategy: Looking for short term trades to the downside.

More By This Author:
Elliott Wave Technical Analysis: Dogecoin/U.S. Dollar - Friday, Aug. 18
Bitcoin Elliott Wave Prediction & Cross-Asset Analysis
Elliott Wave Technical Analysis Day Chart: U.S. Dollar/New Zealand Dollar
Analyst Peter Mathers TradingLounge™ Australian Financial Services Licence - AFSL 317817


