

Image Source: Unsplash
NZDUSD Elliott Wave Analysis Trading Lounge Day Chart, 17 August 2023
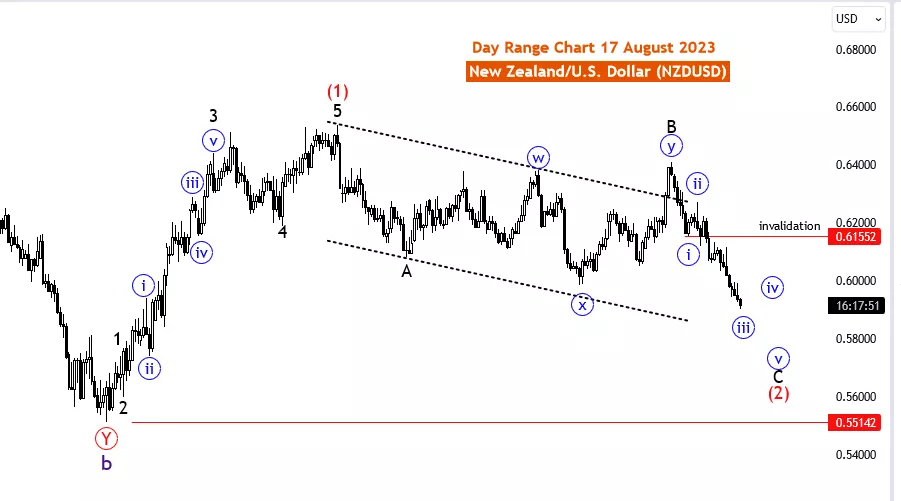
New Zealand Dollar/U.S.Dollar (NZDUSD) Day Chart
NZDUSD Elliott Wave Technical Analysis
Function: Counter Trend
Mode: impulsive
Structure: blue wave 3 of C
Position: Black wave C
Direction Next higher Degrees: subwave 4 of C
Details: Blue wave 3 looking still in play,also looking for corrective wave 4 to start. Wave Cancel invalid level: 0.61553. (After 5th of C of 2 new uptrend expected)
The Elliott Wave analysis for NZDUSD on 17 August 23, scrutinizes the day chart, focusing on counter-trend impulsive movements. This analysis provides traders with insights into potential market movements, wave positions, and the development of corrective phases to facilitate informed trading decisions.
Counter-trend impulsive movements are significant price shifts that oppose the prevailing market trend. Recognizing these movements can offer traders unique trading opportunities that arise from rapid price changes.
The crux of the analysis centers on the blue wave 3 of C. This wave signifies a phase of robust impulsive movement characterized by substantial price shifts. Vigilant observation of market dynamics during this phase is crucial for identifying opportunities to capitalize on short-term price movements.
Attention is directed toward the position of the black wave C, situated within the larger wave hierarchy. Understanding the interplay between these waves is pivotal for gauging potential future price movements and predicting shifts in market sentiment.
The analysis emphasizes the ongoing presence of the blue wave 3, underscoring the continued impulsive phase and the potential for further price movements in the same direction. Additionally, there's anticipation of a corrective wave 4 initiation, indicating a potential price retracement before another bout of impulsive movement.
The Wave Cancel invalid level at 0.61553 serves as a critical threshold. Breaching this level could necessitate a reassessment of the current wave analysis, prompting traders to adapt strategies and risk management practices accordingly.
The analysis also alludes to an upcoming shift in the market's trajectory. After the completion of the 5th wave of C of 2, a new uptrend is anticipated. This observation signals a potential reversal in the prevailing trend, which traders should monitor closely to identify suitable entry and exit points.
In conclusion, the day chart Elliott Wave analysis for NZDUSD on 17 August 23, delves into counter-trend impulsive movements amid the context of the blue wave 3 of C.
This analysis equips traders with insights to navigate short-term price fluctuations, anticipate corrective phases, and make well-informed trading decisions aligned with prevailing market dynamics. However, traders should supplement this analysis with fundamental data and market sentiment to ensure a comprehensive trading approach. Furthermore, adaptable strategies and robust risk management techniques remain essential for successful trading in ever-evolving markets.
More By This Author:
Elliott Wave Analysis: Commodity Futures Trading Strategies
Elliott Wave Technical Analysis: United Parcel Service Inc. Wednesday, August 16
Elliott Wave Technical Analysis: NEO/U.S. Dollar - Wednesday, Aug. 16


Comments
Log in or sign up to join the conversation.