
Elliott Wave Technical Analysis: Intercontinental Exchange Inc. - Friday, June 16

Image Source: Pixabay
Intercontinental Exchange Inc., Elliott Wave Technical Analysis
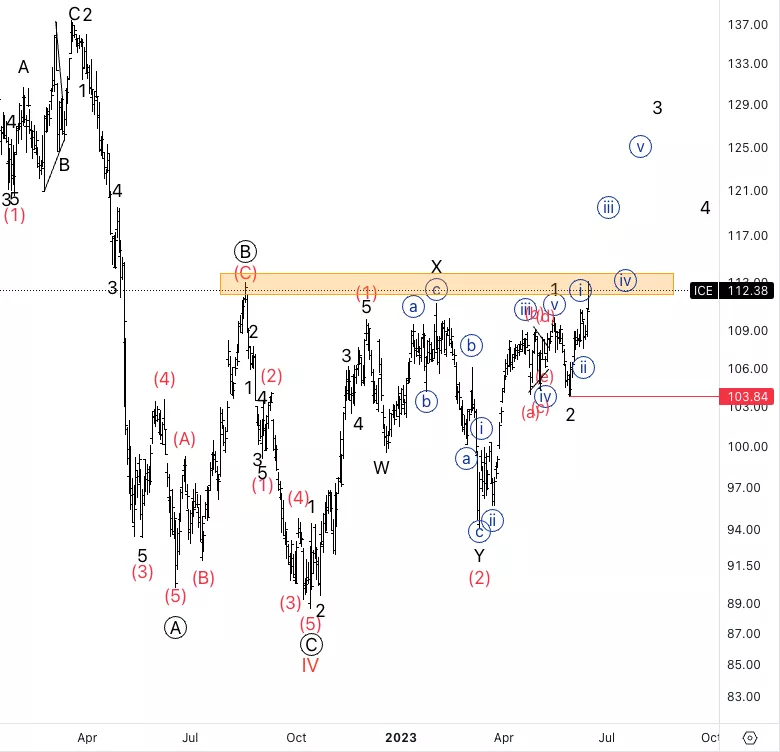
Intercontinental Exchange Inc., (Nasdaq: ICE): Daily Chart, 16 June 2023.
ICE Stock Market Analysis: Moving as expected, looking for further upside to resume the overall uptrend as we start to break higher and facing the strongest zone of resistance before ATH.
ICE Elliott Wave Count: Wave 3 of (3).
ICE Technical Indicators: Above all averages.
ICE Trading Strategy: Looking for upside into wave 3 as we should start accelerating higher as we are in wave {iii} of 3.
Analyst: Alessio Barretta
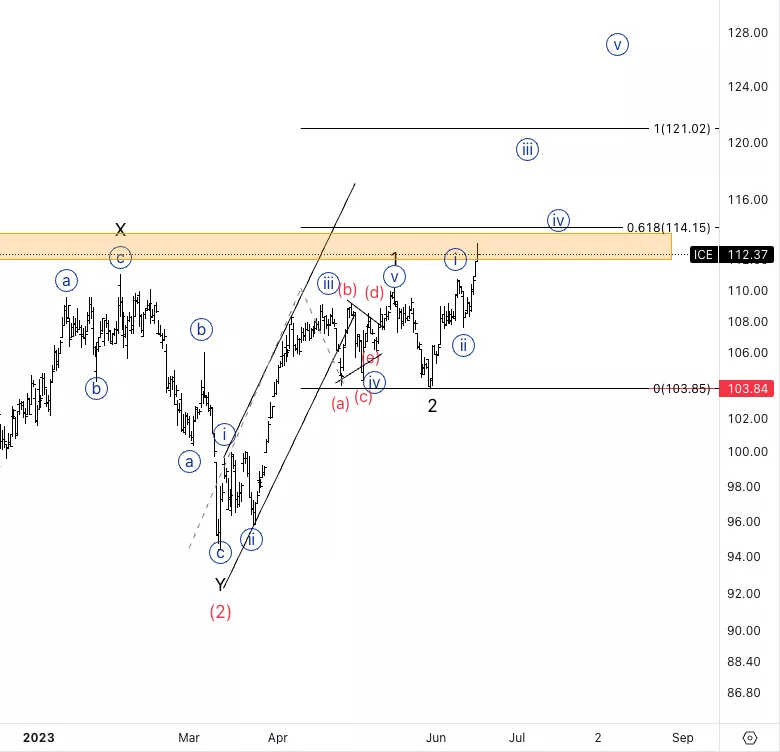
Intercontinental Exchange Inc., ICE: 4-hour Chart, 16 June 2023.
Intercontinental Exchange Inc., Elliott Wave Technical Analysis
ICE Stock Market Analysis: Looking for upside as we seem to have a bottom in place at wave {ii}. Target for wave 3 would be at least around 1.618 3 vs. 1 at 133$.
ICE Elliott Wave count: Wave {iii} of 3.
ICE Technical Indicators: Above all averages.
ICE Trading Strategy: Looking longs into wave {iii} with a stop below wave {ii}.
More By This Author:
Elliott Wave Technical Analysis: Chainlink/U.S. Dollar - Friday, June 16
Elliott Wave Technical Analysis: United Parcel Service Inc. - Thursday, June 15
Elliott Wave Technical Analysis: Ethereum, Thursday, June 15
Analyst Peter Mathers TradingLounge™ Australian Financial Services Licence - AFSL 317817


