

Photo by regularguy.eth on Unsplash
United Parcel Service Inc., Elliott Wave Technical Analysis
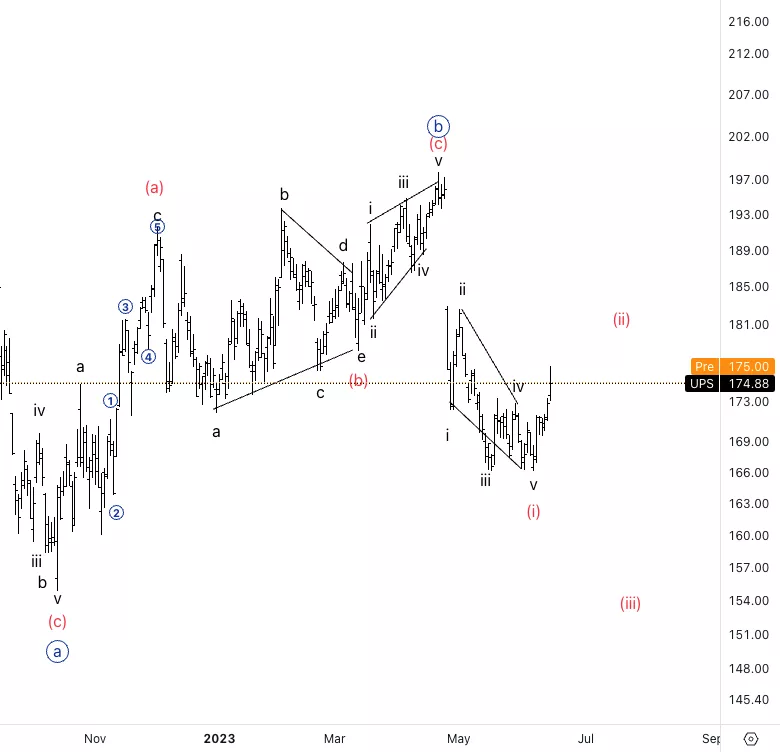
United Parcel Service Inc., (NYSE: UPS): Daily Chart, 15 June 2023.
UPS Stock Market Analysis: We have been looking for downside into wave {c} to complete a higher degree wave 2.
UPS Elliott Wave Count: Wave (ii) of {c}.
UPS Technical Indicators: Between 200 and 20EMA.
UPS Trading Strategy: Looking downside into wave (iii), waiting for a clear three wave move in wave (ii) to have additional confirmation.
Analyst: Alessio Barretta
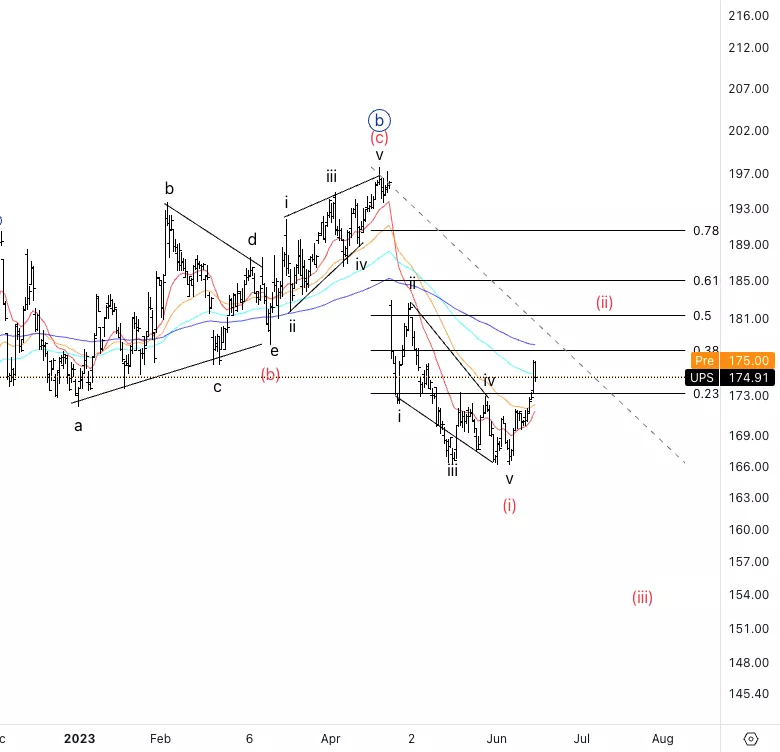
United Parcel Service Inc., UPS: 4-hour Chart, 15 June 2023.
United Parcel Service Inc., Elliott Wave Technical Analysis
UPS Stock Market Analysis: We are looking at an ideal area for wave (ii) to stop. Ideally at around the 50% pullback of wave (i) as we have the previous wave ii of the diagonal.
UPS Elliott Wave count: Wave (ii) of {c}.
UPS Technical Indicators: Below 200EMA
UPS Trading Strategy: Looking for short off of wave (ii).
More By This Author:
Elliott Wave Technical Analysis: Ethereum, Thursday, June 15
Elliott Wave Technical Analysis: Theta Token/U.S. Dollar - Wednesday, June 14
Elliott Wave Technical Analysis: Dexcom Inc., Wednesday, June 14


Comments
Log in or sign up to join the conversation.