Elliott Wave Technical Analysis: Chainlink/U.S. Dollar - Friday, June 16
Image Source: Unsplash
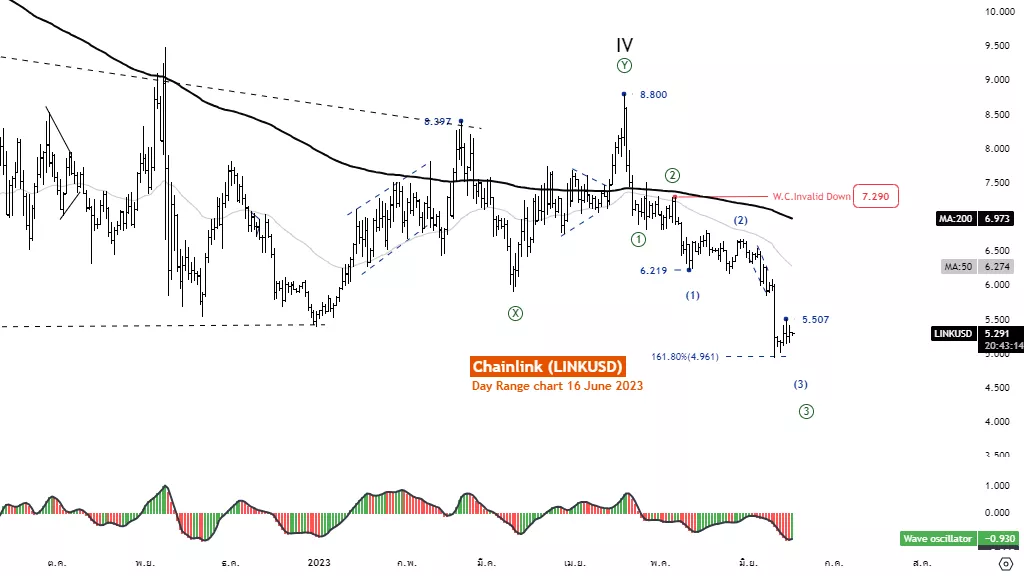
Elliott Wave Analysis TradingLounge Daily Chart, 16 June 2023.
Chainlink/U.S. Dollar(LINKUSD)
LINKUSD Elliott Wave Technical Analysis
Function: Follow trend
Mode: Motive
Structure: Impulse
Position: Wave ((3))
Direction Next higher Degrees: Wave V of Motive
Details: Wave 3 is usually equal to 1.618 multiplied Length of wave 1
Wave Cancel invalid Level:
Chainlink/U.S. Dollar(LINKUSD) Trading Strategy: The downtrend continues. From the decline of wave 3, which corresponds to the price being below the MA200 line, showing a clear downward trend, expecting wave 3 to have support at 4.961
Chainlink/U.S. Dollar(LINKUSD) Technical Indicators: The price is below the MA200 indicating a downtrend. Wave oscillator has a bearish momentum.
Analyst: Kittiampon Somboonsod, CEWA

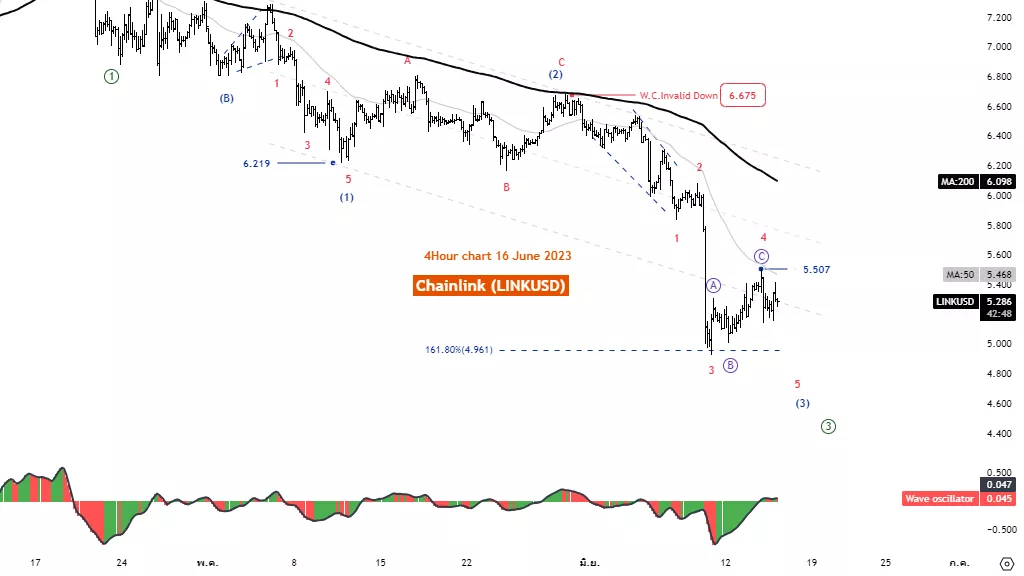
Elliott Wave Analysis TradingLounge 4H Chart, 16 June 2023.
Chainlink/U.S. Dollar(LINKUSD)
LINKUSD Elliott Wave Technical Analysis
Function: Follow trend
Mode: Motive
Structure: Impulse
Position: Wave ((3))
Direction Next higher Degrees: Wave V of Motive
Details: Wave 3 is usually equal to 1.618 multiplied Length of wave 1
Wave Cancel invalid Level: 6.675
Chainlink/U.S. Dollar(LINKUSD) Trading Strategy: The downtrend continues. From the decline of wave 3, which corresponds to the price being below the MA200 line, showing a clear downward trend, expecting wave 3 to have support at 4.961
Chainlink/U.S. Dollar(LINKUSD) Technical Indicators: The price is below the MA200 indicating a downtrend. Wave oscillator has a bearish momentum.

More By This Author:
Elliott Wave Technical Analysis: United Parcel Service Inc. - Thursday, June 15
Elliott Wave Technical Analysis: Ethereum, Thursday, June 15
Elliott Wave Technical Analysis: Theta Token/U.S. Dollar - Wednesday, June 14
Analyst Peter Mathers TradingLounge™ Australian Financial Services Licence - AFSL 317817


