

Photo by Kanchanara on Unsplash
Intel Corp., Elliott Wave Technical Analysis
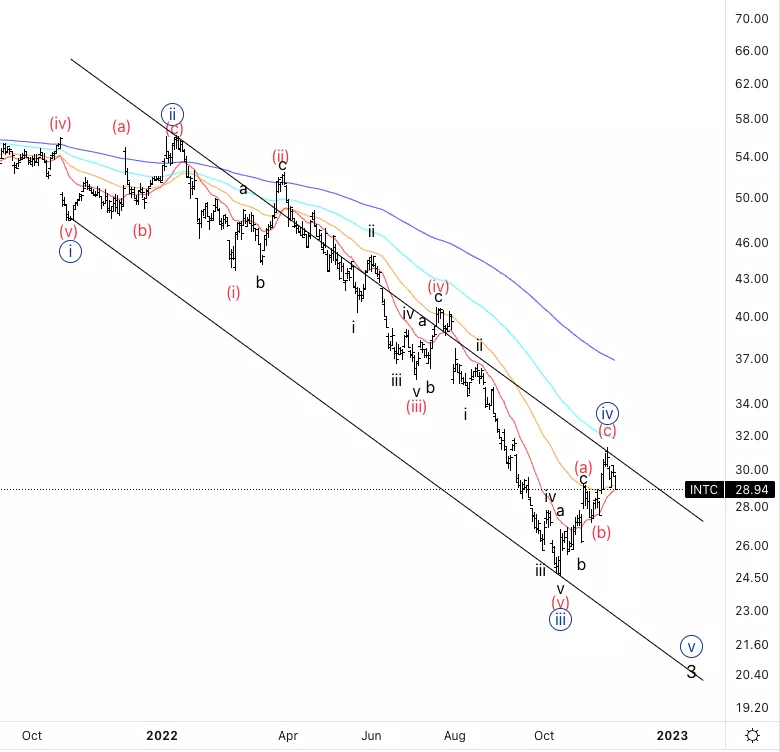
Intel Corp., (Nasdaq: INTC): Daily Chart, November 22, 2022,
INTC Stock Market Analysis: It has been pulling back as expected from the last update. At this point, there are reasons to believe the correction might have ended as we touched the parallel trend channel.
INTC Elliott Wave Count: Wave {iv} of 3.
INTC Technical Indicators: Trying to cross the 20EMA.
INTC Trading Strategy: Looking for confirmation as we could just be in wave (a) of {iv}.
Analyst: Alessio Barretta
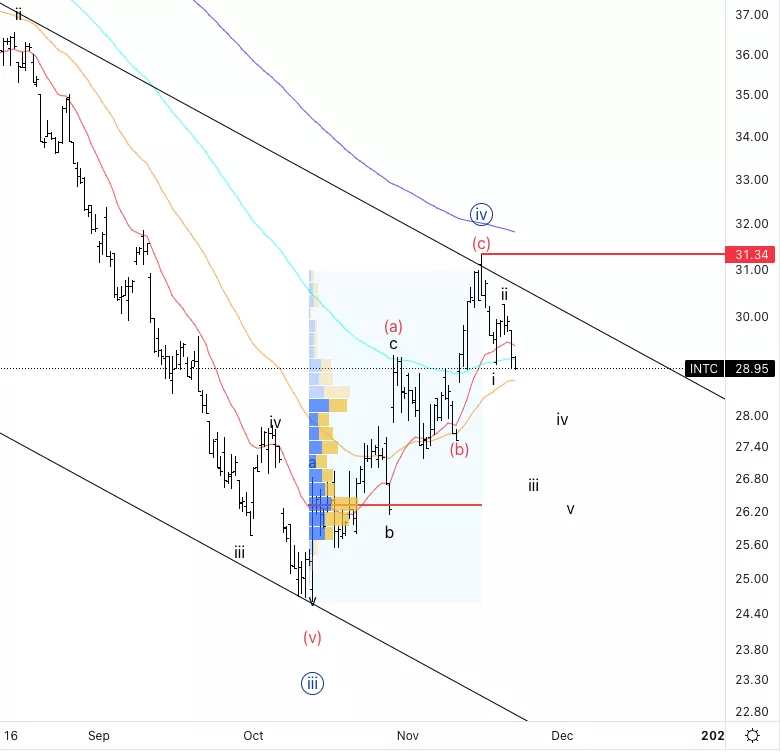
Intel Corp., INTC: 4-hour Chart, November 22, 2022
Intel Corp., Elliott Wave Technical Analysis
INTC Stock Market Analysis: We could have already had wave i and ii of (i). We should have the support of around 26$ which may correspond to the end of the five waves down into wave (i).
INTC Elliott Wave count: Wave (i) of {v}.
INTC Technical Indicators: We have the averages crossing which is often time a sign of reversal.
INTC Trading Strategy: Looking for short even if we do not have confirmation yet. An aggressive trade would be short with a stop above the red line at 31.3$.
More By This Author:
Bitcoin's Bear Market Structure - Elliott Wave Analysis
Elliott Wave Technical Analysis: Fortinet Inc. - Monday, Nov. 21
Elliott Wave Technical Analysis: Cardano - Monday, Nov. 21


Comments
Log in or sign up to join the conversation.