Elliott Wave Technical Analysis: Fortinet Inc. - Monday, Nov. 21

Image Source: Pixabay
Fortinet Inc., Elliott Wave Technical Analysis
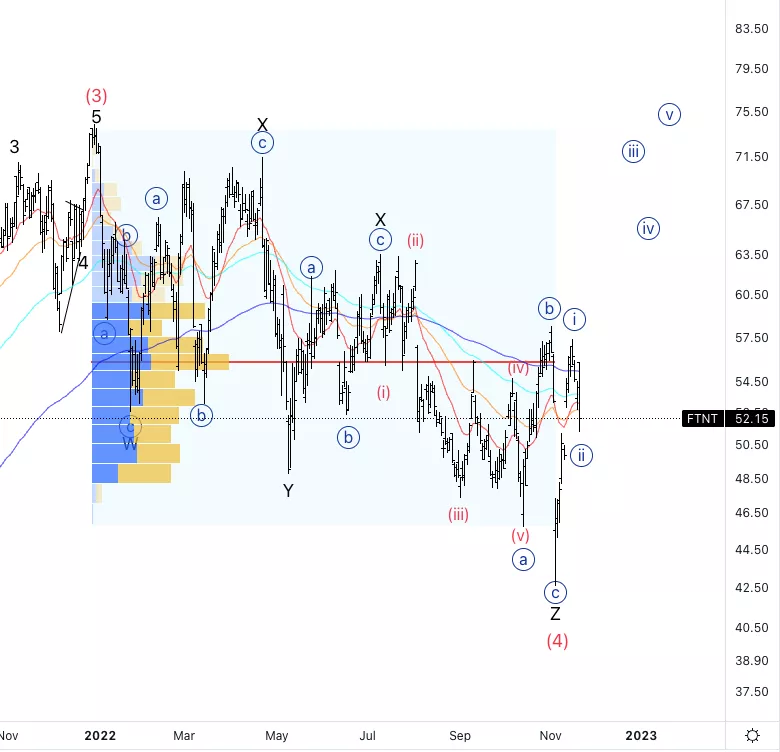
Fortinet Inc.,(Nasdaq: FTNT): Daily Chart, November 21, 2022,
FTNT Stock Market Analysis: We have had a sharp move up off the lows which could represent the end of the correction in wave (4). At this point, we’ll be looking for further downside.
FTNT Elliott Wave Count: Wave {i} of 1.
FTNT Technical Indicators:200EMA acting as resistance, we are also facing resistance as west and near the highest volume of the entire correction.
FTNT Trading Strategy: Looking for confirmation with a break of the bearish structure.
Analyst: Alessio Barretta

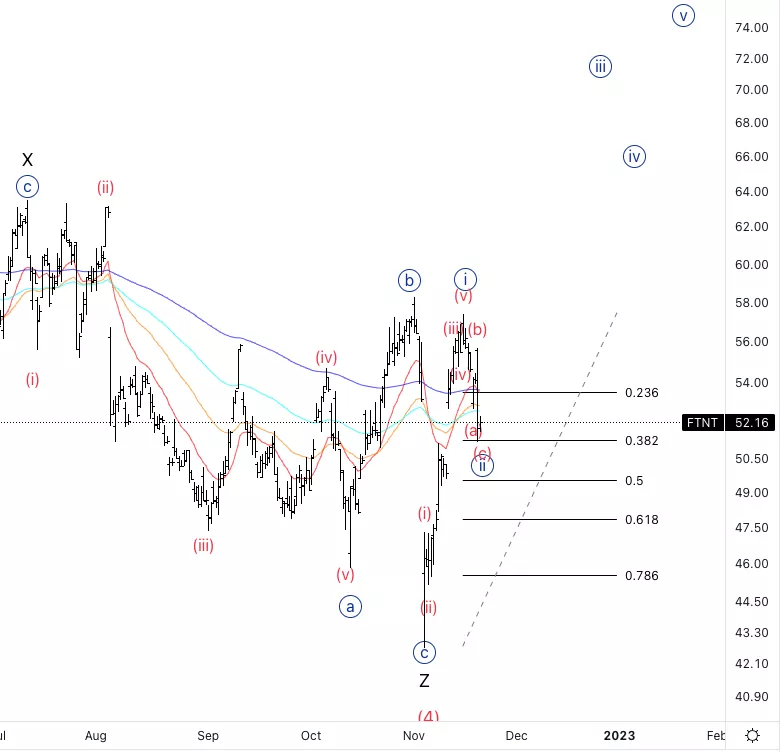
Fortinet Inc., FTNT: 4-hour Chart, November 21, 2022
Fortinet Inc., Elliott Wave Technical Analysis
FTNT Stock Market Analysis: We are looking at a three-wave down off wave {i} so far as we could retrace deeper.
FTNT Elliott Wave count: Wave (c) of {ii}.
FTNT Technical Indicators: It dropped below all averages and reacted off the 38.2% retracement.
FTNT Trading Strategy: Looking for a resumption of the uptrend in wave (i) of {iii} to then start looking for longs.

More By This Author:
Elliott Wave Trading Strategies: DAX 40, FTSE 100, EUROSTOXX 50, FOREX: DXY Dollar, GBPUSD, EURUSD - Monday, Nov. 21
Australian Stock Market Elliott Wave Technical Analysis: ASX200, Mining, Currencies
SP 500 Stock Market Summary - Elliott Wave v)
Disclosure: As with any trading or investment opportunity there is a risk of making losses especially in day trading or investments that Trading Lounge expresses opinions on. Note: Historical ...
more


