


Photo by Jason Briscoe on Unsplash
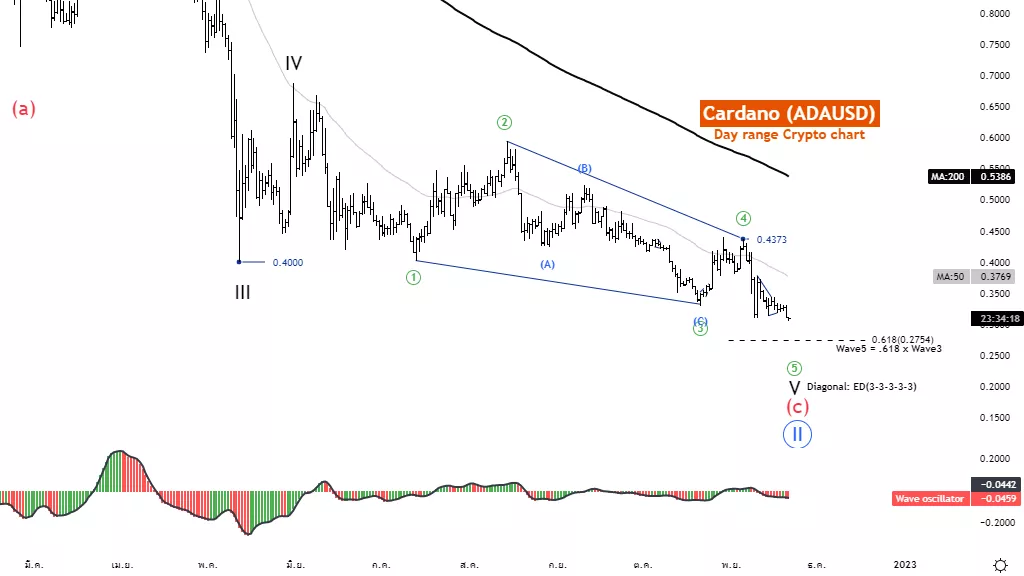
Elliott Wave Analysis TradingLounge Daily Chart, 21 November 2022,
Cardano (ADAUSD)
ADAUSD Elliott Wave Technical Analysis
Function: Follow trend
Mode: Motive
Structure: Diagonal
Position: Wave 5
Direction Next higher Degrees: Sub-wave of Wave C
Details: wave 5 in diagonal Usually has a length of .618 x the length of wave3 at level 0.2754.
Wave Cancel invalid level: Cardano (ADAUSD) Trading Strategy: The final drop in the bear market There is overlap indicating a slowdown in the Diagonal Triangle pattern. Overall, the ADAUSD is still in a downtrend as prices are still below the MA50 MA200, although this is the end of the trend. Enter trades should wait for confirmation of a reversal to an uptrend first. because the price is still being pressured by buried sales.
Cardano (ADAUSD) Technical Indicators: The price is below the MA200 MA50, indicating a downtrend. The Wave oscillator below Zero-Line Momentum is bearish.
Analyst: Kittiampon Somboonsod
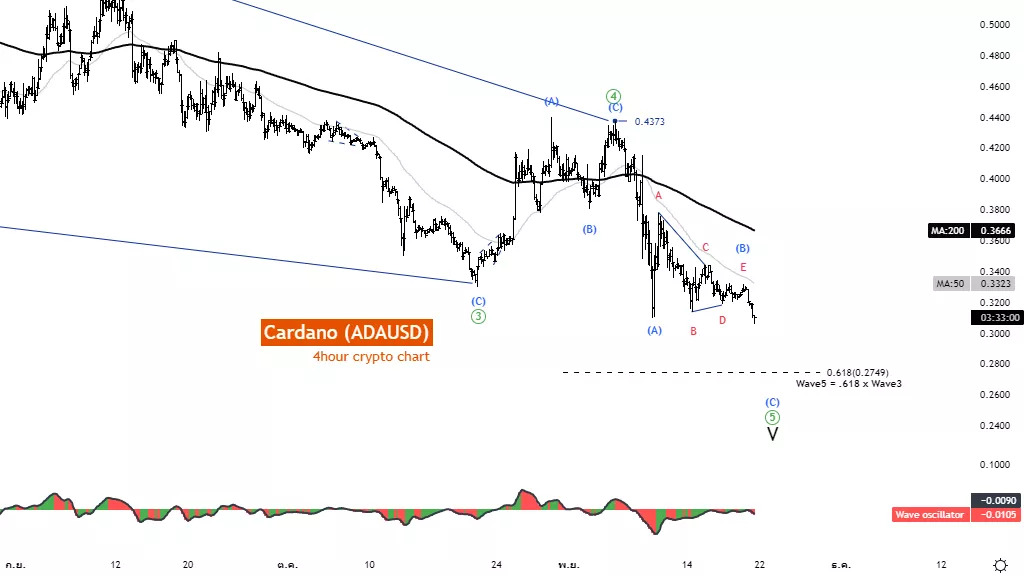
Elliott Wave Analysis TradingLounge 4H Chart, 21 November 2022,
Cardano (ADAUSD) Elliott Wave Technical Analysis
Function: Follow trend
Mode: Motive
Structure: Diagonal
Position: Wave 5
Direction Next higher Degrees: Sub-wave of Wave C
Details: wave 5 in diagonal Usually has a length of .618 x the length of wave3 at level 0.2754.
Wave Cancel invalid level:
Cardano (ADAUSD)Trading Strategy: The final drop in the bear market There is overlap indicating a slowdown in the Diagonal Triangle pattern. Overall, the ADAUSD is still in a downtrend as prices are still below the MA50 MA200, although this is the end of the trend. Enter trades should wait for confirmation of a reversal to an uptrend first because the price is still being pressured by buried sales
Cardano (ADAUSD) Technical Indicators: The price is below the MA200 MA50, indicating a clear downtrend. The Wave oscillator below Zero-Line Momentum is bearish.
More By This Author:
Australian Stock Market Elliott Wave Technical Analysis: ASX200, Mining, Currencies
SP 500 Stock Market Summary - Elliott Wave v)
Elliott Wave Technical Analysis: Analog Devices Inc. - Friday, Nov. 18



Comments
Log in or sign up to join the conversation.