
ABBV – Elliott Wave Analysis
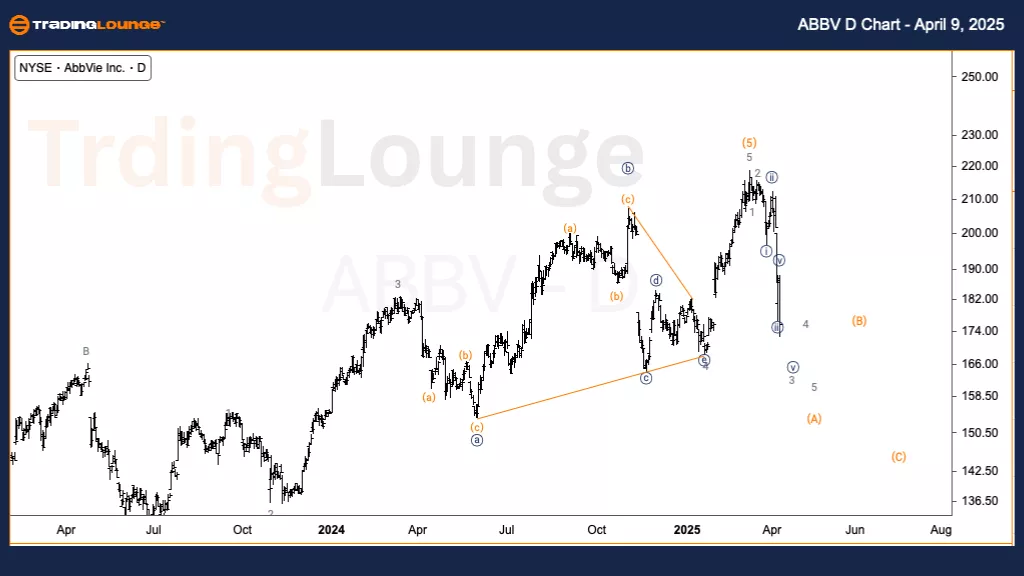
Daily Chart
Function: Counter Trend
Mode: Corrective
Structure: ZigZag
Position: Wave 3 of (A)
Direction: Downside within wave (A)
Details: Anticipating continued movement lower within Intermediate wave (A), targeting the previous fourth wave near $165. The sharp decline indicates early stages of a potential trend, justifying the wave (A) designation.
ABBV – Elliott Wave Analysis
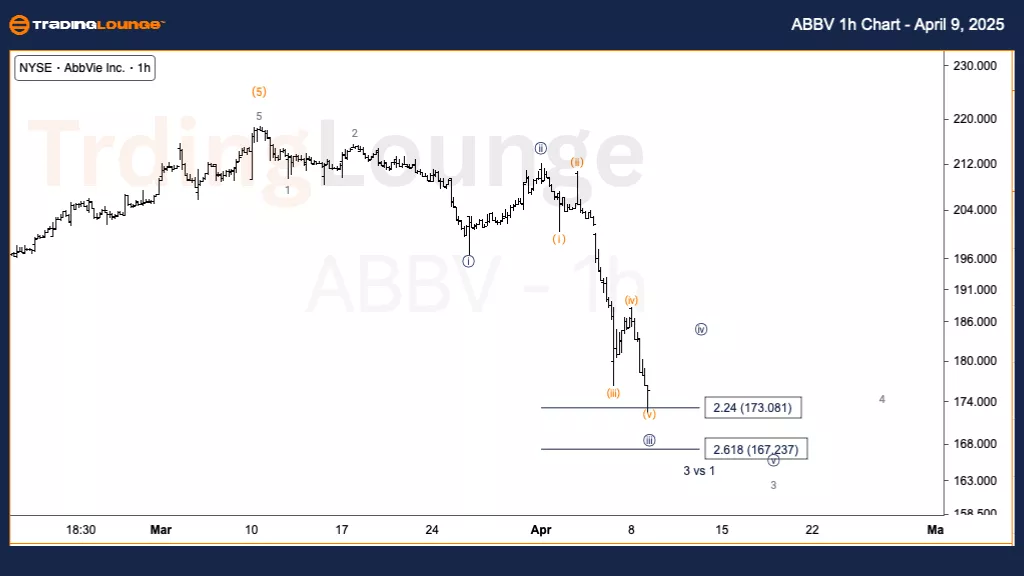
1H Chart
Function: Counter Trend
Mode: Corrective
Structure: ZigZag
Position: Wave {iii} of 3
Direction: Downside in wave 3
Details: Looking for a continuation lower within wave {iii}, nearing a short-term bottom. Expecting minor three- and four-wave structures to follow as wave (A) develops.
ABBV Summary
ABBV is currently showing a pronounced move down in both daily and 1-hour charts, suggesting a deeper ZigZag correction in play. Positioned in wave 3 of Intermediate wave (A), price action is aligning with expectations of further downside toward the $165 level. Momentum supports the idea that wave (A) could be the beginning of a larger correction. In the 1-hour chart, wave {iii} of 3 is progressing, with pullbacks likely to present short-term trading opportunities as the broader structure unfolds.
Technical Analyst: Alessio Barretta
More By This Author:
Elliott Wave Technical Analysis: Car Group Limited - Wednesday, April 9
Elliott Wave Technical Analysis: British Pound/Japanese Yen - Wednesday, April 9
Elliott Wave Technical Analysis: Ethereum Crypto Price News For Wednesday, April 9


Comments
Log in or sign up to join the conversation.