
British Pound/Japanese Yen (GBPJPY) Day Chart
GBPJPY Elliott Wave Technical Analysis
FUNCTION: Counter Trend
MODE: Corrective
STRUCTURE: Navy blue wave Y
POSITION: Gray wave 2
DIRECTION NEXT HIGHER DEGREES: Gray wave 3
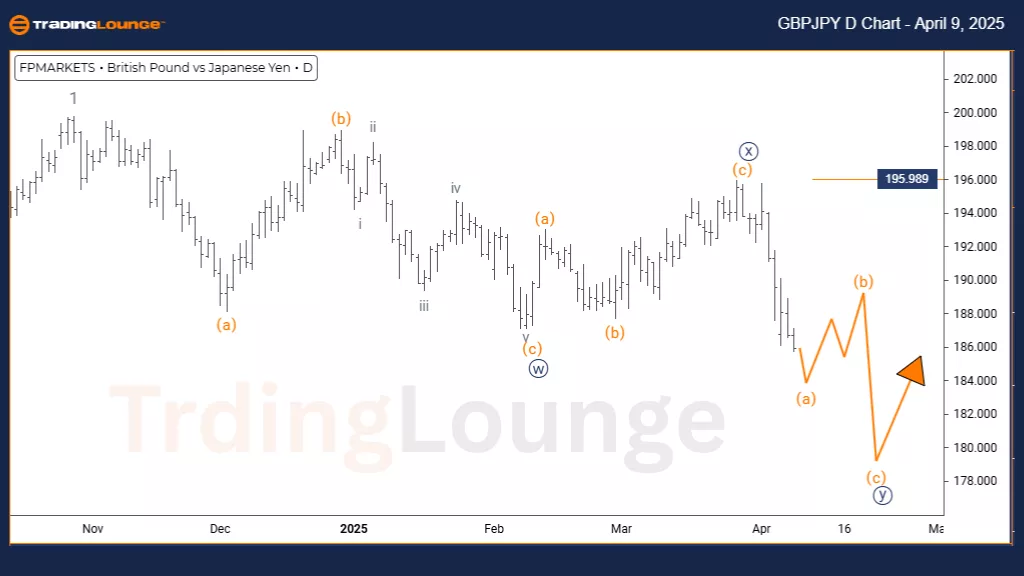
DETAILS: Navy blue wave X appears complete, and orange wave Y of 2 is currently unfolding.
Wave Cancel Invalid Level: 195.998
The GBPJPY Elliott Wave Analysis on the daily chart outlines a well-defined counter-trend scenario for the currency pair, currently in a corrective phase within a broader pattern. The focus is on navy blue wave Y, which forms part of the larger gray wave 2. Analysts confirm that the corrective move of navy blue wave X is complete, and the market is now developing orange wave Y of gray wave 2. This implies a short-term interruption in the overall trend before a potential directional continuation.
This daily chart view helps traders understand the pair's placement within the broader wave structure, with navy blue wave Y progressing inside gray wave 2. A key technical level, 195.998, serves as the invalidation point—if price breaches this, the current wave outlook would be reconsidered. This reference level is essential for validating the unfolding corrective structure.
This analysis highlights the importance of wave degree interaction, positioning navy blue wave Y as both a medium-term trading event and a component of gray wave 2. Traders should look for signs of typical corrective behavior, such as three-wave formations or sideways consolidation—common in counter-trend phases. The chart suggests waiting for confirmation of pattern completion before acting on the next likely move in GBPJPY. This setup offers valuable insight for both short-term strategies and broader market positioning.
British Pound/Japanese Yen (GBPJPY) 4 Hour Chart
GBPJPY Elliott Wave Technical Analysis
FUNCTION: Counter Trend
MODE: Impulsive as A
STRUCTURE: Orange wave A
POSITION: Navy blue wave Y
DIRECTION NEXT HIGHER DEGREES: Orange wave B
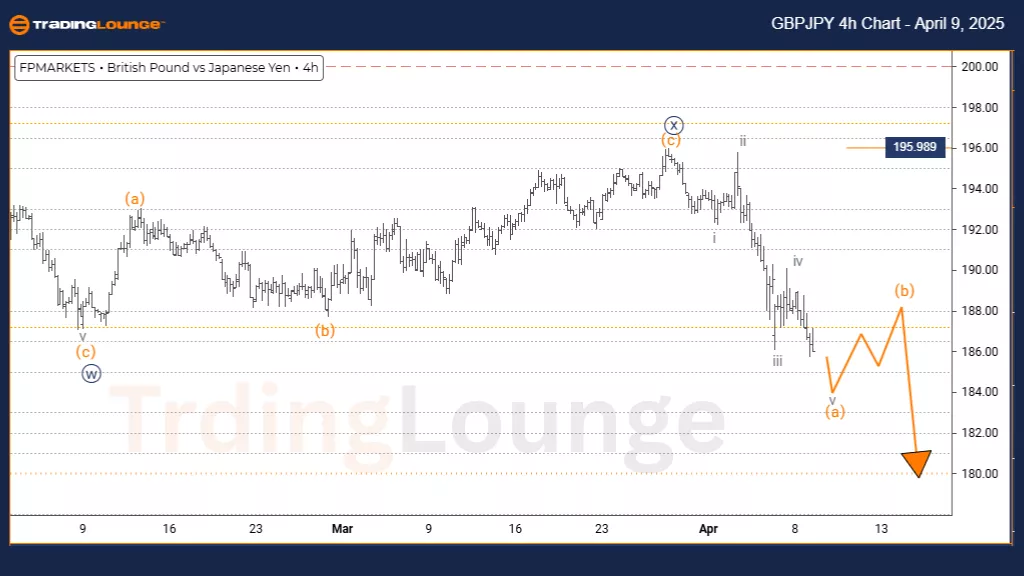
DETAILS: Navy blue wave X appears complete, with orange wave A of Y now underway.
Wave Cancel Invalid Level: 195.998
The GBPJPY Elliott Wave Analysis on the 4-hour chart offers a counter-trend view, highlighting a notable corrective structure in development. The current focus is on orange wave A, part of the broader navy blue wave Y. Market analysts note the completion of navy blue wave X, with the pair now entering an impulsive orange wave A of Y. This marks the beginning of a potentially meaningful counter-trend phase for GBPJPY.
A key level to watch is 195.998, the invalidation point that, if broken, would challenge this wave outlook. The 4-hour chart grants traders precise visibility into the evolving impulsive structure, while also placing it within the larger corrective pattern. The impulsive nature of wave A within a corrective setup is consistent with typical wave dynamics and indicates initial strength in this move.
This framework underscores the relevance of wave degree relationships, as orange wave A represents both a near-term trading setup and a part of the larger navy blue wave Y. Traders should monitor for impulsive traits, such as strong directional momentum—often seen in early corrective moves. The current setup encourages careful assessment of both short-term trades and broader strategic positioning in GBPJPY, particularly with respect to the invalidation level.
Technical Analyst: Malik Awais
More By This Author:
Elliott Wave Technical Analysis: Ethereum Crypto Price News For Wednesday, April 9
Elliott Wave Analysis: Netflix Inc. - Tuesday, April 8
Elliott Wave Technical Analysis: British Pound/U.S. Dollar - Tuesday, April 8


Comments
Log in or sign up to join the conversation.