
GBPUSD Elliott Wave Analysis – TradingLounge Daily Chart
British Pound / U.S. Dollar (GBPUSD) Elliott Wave Technical Analysis
- Function: Counter-Trend
- Mode: Corrective
- Structure: Navy Blue Wave 2
- Position: Gray Wave 1
- Next Higher Degree Direction: Navy Blue Wave 3
- Invalidation Level: 1.21000
Analysis Overview:
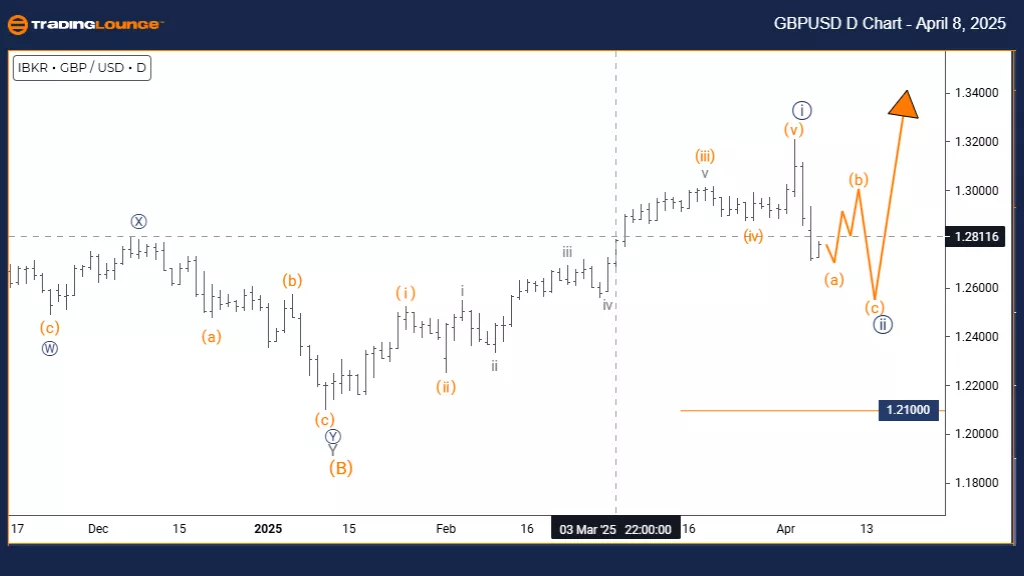
The daily GBPUSD chart presents a detailed counter-trend view of the current market conditions. This analysis highlights the ongoing Navy Blue Wave 2 correction, which is developing within the context of the larger Gray Wave 1 formation.
Technical indicators suggest that Navy Blue Wave 1 has concluded, and the market is now moving through the corrective stage of Wave 2. This phase indicates a temporary pause in the existing trend before the expected continuation in the direction of Navy Blue Wave 3.
The 1.21000 level is identified as the critical invalidation point. A move below this would disrupt the wave count and suggest a reassessment of the structure is needed.
Market Context & Strategy Implications:
The daily chart allows for a comprehensive view of GBPUSD's placement within the higher degree wave cycle. The correction seen in Navy Blue Wave 2 forms part of the overarching Gray Wave 1 movement.
This setup reinforces the importance of wave degree alignment. Market participants should look for standard corrective patterns—such as ABC three-wave formations or lateral consolidations—common during counter-trend moves.
Trading Considerations:
- For Short-Term Traders: Watch for signs of correction completion for entry signals.
- For Long-Term Investors: Monitor this pullback as a potential setup for the next impulsive wave.
- Key Risk Level: Maintain awareness of the 1.21000 invalidation level.
GBPUSD Elliott Wave Analysis – TradingLounge 4-Hour Chart
British Pound / U.S. Dollar (GBPUSD) Elliott Wave Technical Analysis
- Function: Counter-Trend
- Mode: Corrective
- Structure: Navy Blue Wave 2
- Position: Gray Wave 1
- Next Higher Degree Direction: Navy Blue Wave 3
- Invalidation Level: 1.21000
Analysis Overview:
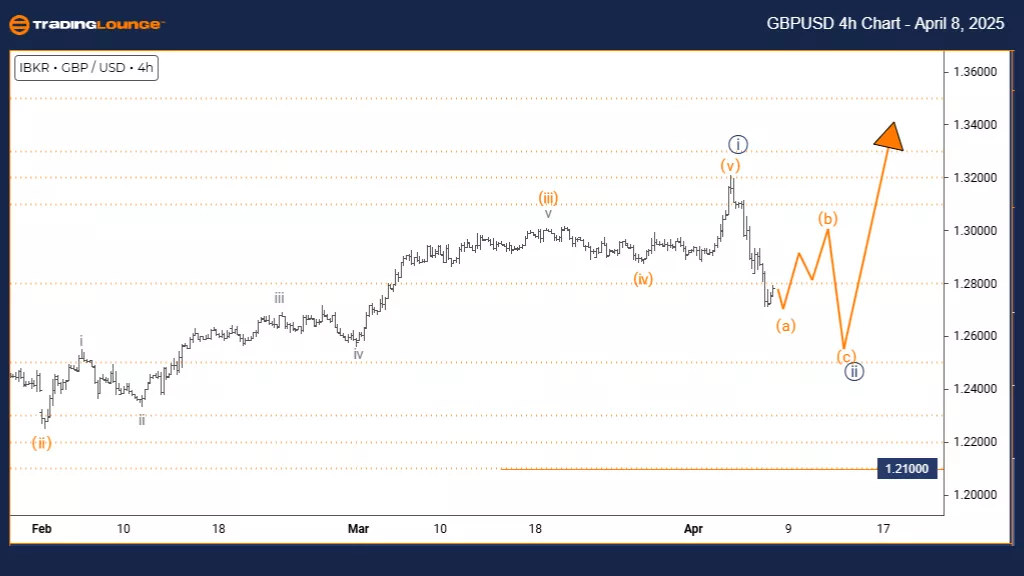
The 4-hour GBPUSD chart reflects a counter-trend outlook, spotlighting a corrective wave structure amid a broader Elliott Wave formation. The current focus is on Navy Blue Wave 2, which forms part of the larger Gray Wave 1 structure.
The earlier Navy Blue Wave 1 appears complete, and the market has transitioned into Navy Blue Wave 2, suggesting a retracement phase before resuming the primary direction. This corrective move is seen as a pause within the prevailing trend.
A breach below 1.21000 would invalidate this wave setup, marking a key level for technical confirmation. The 4-hour time frame provides an effective lens for tracking this correction and assessing the potential transition into Navy Blue Wave 3, expected to be impulsive.
Wave Dynamics & Strategy Implications:
This setup emphasizes the importance of tracking wave degree interactions. Navy Blue Wave 2 serves not only as a near-term structure but also as a component of the broader Gray Wave 1.
Traders should remain alert for typical corrective wave behaviors—such as three-wave formations or lateral consolidation—which are common in counter-trend phases.
Trading Insight:
- Short-Term Opportunity: Capitalize on corrective pullbacks within Wave 2
- Long-Term Positioning: Prepare for trend continuation into Wave 3
- Risk Management: Monitor the invalidation level at 1.21000
Analyst: Malik Awais
More By This Author:
Elliott Wave Technical Forecast: Insurance Australia Group Limited - Monday, April 7
Elliott Wave Technical Analysis: Amazon
Elliott Wave Technical Analysis: U.S. Dollar/Japanese Yen - Monday, April 7


Comments
Log in or sign up to join the conversation.