
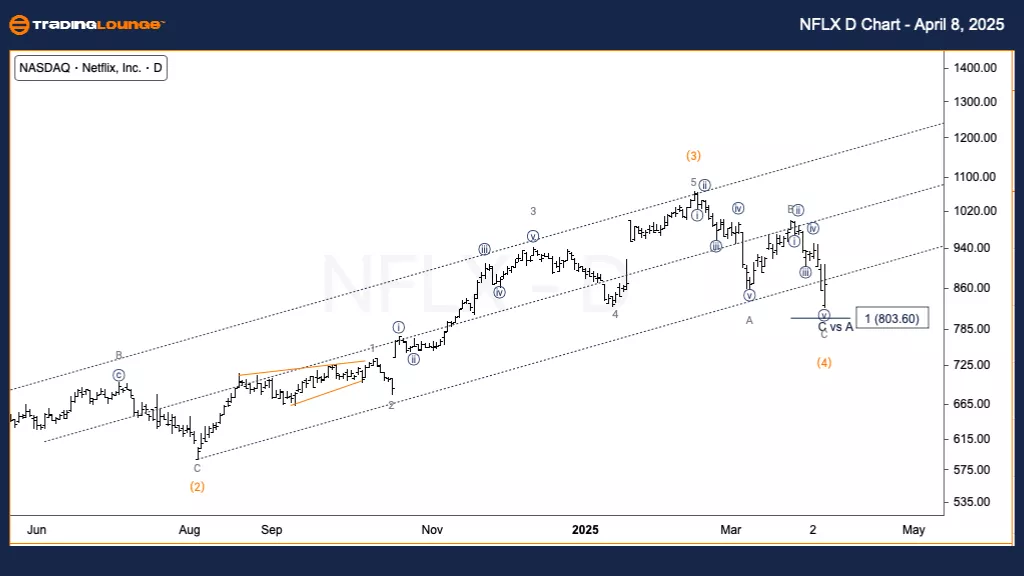
Netflix Inc. (NFLX)
Daily Chart – Elliott Wave Analysis
- Function: Counter-Trend
- Mode: Corrective
- Structure: ZigZag
- Position: Wave C of (4)
- Direction: Approaching Bottom in Wave C
- Details: NFLX is within a ZigZag correction, still inside the base channel, with support around $800 potentially acting as a floor. Confirmation of Wave C's bottom could trigger an upward trend in Wave (5).
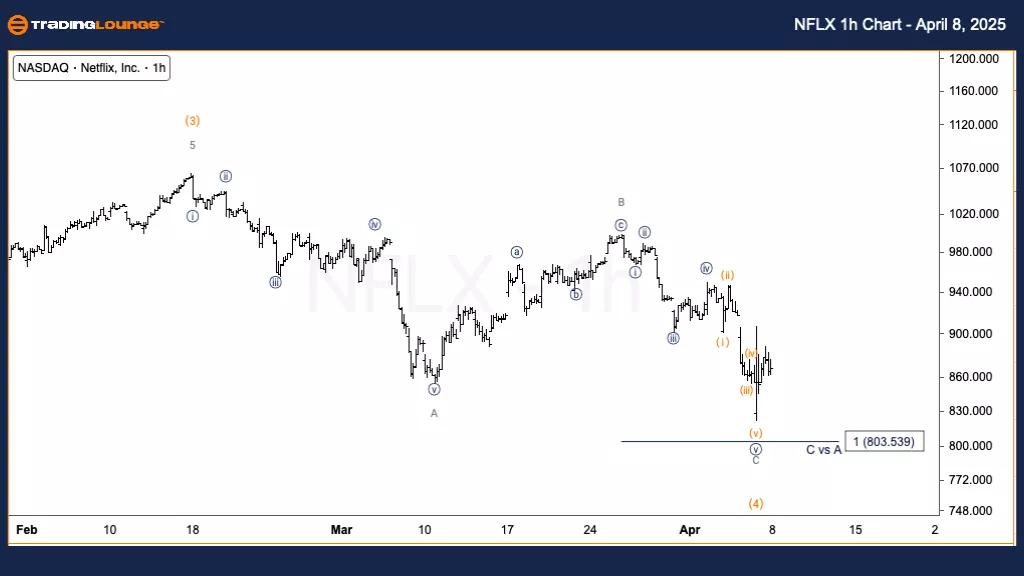
1-Hour Chart – Elliott Wave Analysis
- Function: Counter-Trend
- Mode: Corrective
- Structure: ZigZag
- Position: Wave {v} of C
- Direction: Bottom forming in Wave {v}
- Details: A five-wave move within Wave C is near completion, stopping just shy of the equality target (C vs. A). However, due to volatility, confirmation through upside breakout is essential.
Technical Analyst: Alessio Barretta
More By This Author:
Elliott Wave Technical Analysis: AAVE Crypto Price News For Tuesday, April 8
Elliott Wave Technical Forecast: Insurance Australia Group Limited - Monday, April 7
Elliott Wave Technical Analysis: Amazon


Comments
Log in or sign up to join the conversation.