
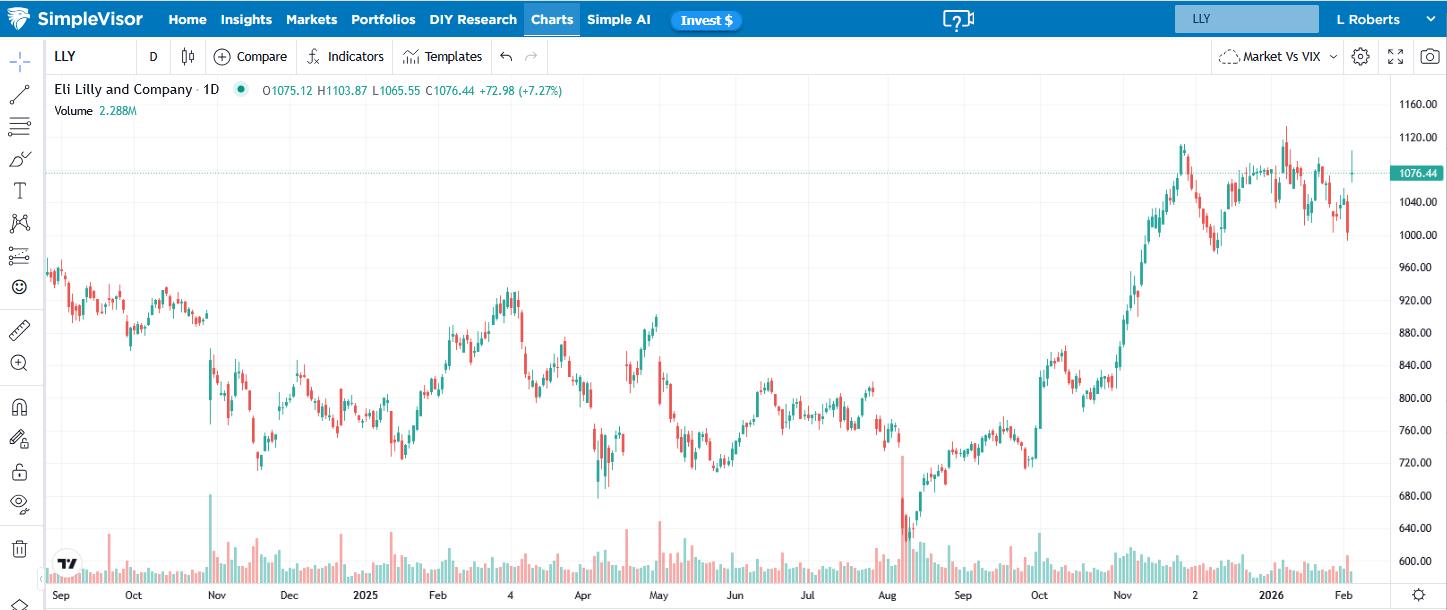
Eli Lilly Shares Boosted BY GLP-1s
On Wednesday, Eli Lilly (LLY), the largest holding (15%) in XLV, the State Street healthcare sector ETF, reported earnings well above expectations, and its shares initially rose by 10%. Its fourth-quarter adjusted EPS of $7.54 easily beat the consensus estimate of $6.98. Further boosting Eli Lilly shares, its revenue surged 43% to $19.29 billion, almost $1.5 billion above forecasts.
The impressive growth was largely driven by strong sales of its blockbuster GLP-1 weight-loss drugs, Mounjaro and Zepbound, which continue to dominate the GLP-1 market. To wit, Eli Lilly’s market share rose to 60.5% last quarter. Further boosting the shares of Eli Lilly, the company provided an optimistic 2026 outlook with revenue expectations of $3 to $6 billion above Wall Street forecasts. The positive market reaction follows recent weakness triggered by a subdued outlook from its competitor, Novo Nordisk.
Some investors claim Eli Lilly shares are expensive, with a P/E of 54. However, this calculation only includes prior earnings. If we incorporate one-year earnings growth expectations, we arrive at a forward P/E of 33, which is still expensive but not as much as the P/E suggests. However, projecting earnings over the next 3-5 years yields a PEG ratio of 0.71. If Eli Lilly can grow earnings at 46% annually over the next few years, as the market expects, the shares are cheap. To put the robust forecast into context, Nvidia’s expected growth rate is 49%.
(Click on image to enlarge)
What To Watch Today
Earnings

Economy
(Click on image to enlarge)

Market Trading Update
Yesterday, we discussed the market rotation setup. Over the past few weeks, the media has begun focusing on the SaaS (Software as a Service) sector, which has been under immense pressure. This has been a function of the market repricing both growth duration and business-model defensibility simultaneously. The near-term catalyst has been a fresh wave of AI disruption anxiety; investors are increasingly worried that powerful, general-purpose AI tools could replicate or commoditize parts of what many software platforms sell, especially workflow, knowledge, and productivity functions. That fear doesn’t require an immediate collapse in earnings to pressure prices; it only takes a change in how much investors are willing to pay for future cash flows.
At the same time, the “AI narrative premium” is fading. Companies now need to show measurable monetization from better bookings, improved retention, higher pricing power, or clear margin leverage, rather than simply announcing new AI features. Layer in the usual headwinds for high-multiple software, including sensitivity to interest rates and any renewed uncertainty around enterprise IT spending, and you get classic multiple compression. In crowded sectors like SaaS, selling can also snowball as funds and ETFs reduce exposure to the entire basket at once, amplifying the move.
However, the question is whether it is time to start looking at accumulating a position in that sector.
Technically, the sector is very oversold and bouncing off the 50-week moving average. Previous such oversold levels have led to very strong reflexive rallies once the narrative passed.
(Click on image to enlarge)

A reasonable contrarian fundamental case for select SaaS stocks starts with a simple observation: the sector has been trading like a single “macro + narrative” factor, not a collection of distinct business models. When the market sells a crowded basket indiscriminately, often driven by AI-disruption fears and broad de-risking, you can get temporary mispricing where company-specific fundamentals matter less than positioning and sentiment. That’s often when oversold conditions show up: prices fall faster than underlying recurring revenue streams, and valuation multiples compress even for businesses that still have durable retention, high gross margins, and improving free-cash-flow profiles. As shown, valuations are at some of the lowest levels we have seen since 2020.

Lastly, demand durability remain strong. Even as the mix of enterprise spending shifts toward AI and cloud infrastructure, overall IT budgets are still expected to grow, and software remains a core operating expense rather than a discretionary “nice to have” for many firms. If spending is merely reshuffled, not slashed, then quality SaaS businesses with strong customer lock-in can stabilize faster than their share prices imply.
The contrarian opportunity in the sector is also about “selectivity.” Not every company will win, and some will indeed lose. However, we can look for firms that can demonstrate AI as a measurable tailwind to retention and pricing, are operating efficiently (profitability and free-cash-flow discipline), and have balance sheets that reduce refinancing risk. A “Rule of 40” style framework—balancing growth with profitability—can help separate durable compounders from “story stocks.”
The risk is clear: if AI commoditizes a product category faster than vendors can defend their moat, “cheap” can stay cheap. But for companies with real switching costs, data advantages, and provable monetization, compressed valuations plus oversold conditions can set up attractive forward returns.
As investors we are always focused on what’s going up and chasing returns. However, we should be focusing on what is cheap and will likely provide outstanding long-term opportunities.
Just something to think about.
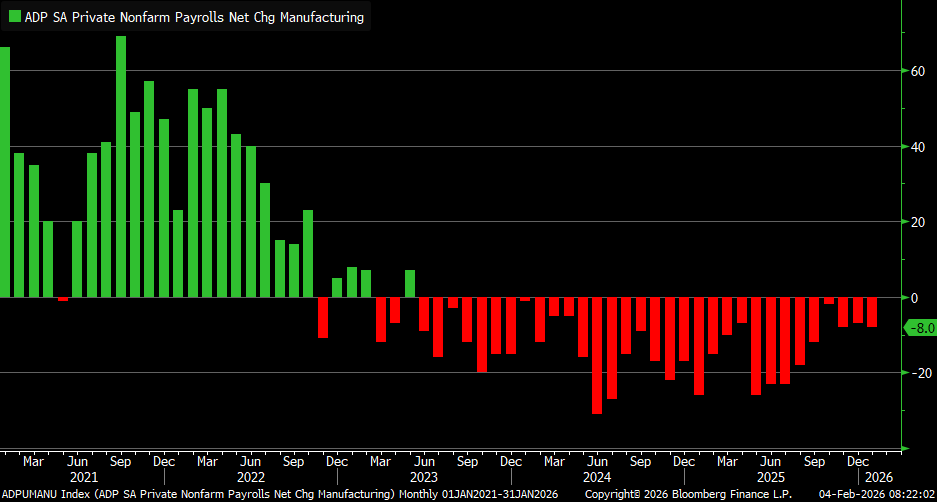
ADP And ISM Services
With JOLTS and Friday’s BLS employment report delayed, yesterday’s ADP release is the primary source of employment data for the time being. ADP reported that the economy generated 22k jobs in January, about half of Wall Street’s estimates. Interestingly, while the ISM Manufacturing survey was very strong, including a decent boost to its employment gauge, the ADP manufacturing employment index continues to show job losses. Yesterday’s reading was the 32nd straight month of declines.
On the heels of the very strong ISM Manufacturing survey, the ISM services gauge was unchanged but remains in expansionary territory (>50) at 53.8. Unlike the manufacturing survey, employment and new orders fell in the service sector. It’s worth noting that the ISM services gauge is a much more valuable gauge of the broad economy, as the service sector accounts for nearly 80% of GDP. The table below shows the survey breakdown by component.

Japan Is Normalizing: Risks To The Yen Carry Trade
“Japan Bond Meltdown Sends Yields to Record High on Fiscal Fears,” read a January 2026 Bloomberg article. Headlines like this, and many others, warn that Japan’s abrupt interest rate increase is an omen of dire trouble. While that may be the case, given decades of economic woes, declining demographics, and extreme levels of outstanding debt, we have an alternative view.
Might the recent sharp rise in Japanese yields simply reflect the normalization of its economy, inflation, and interest rates following decades of stagnation and very aggressive monetary and fiscal policies?
Whether you follow Japan or not, its situation is incredibly important for investors because it is a major provider of global liquidity. Instead of being overly dramatic about the slim chance of a near-term Japanese crisis, we prefer to focus on how Japan normalizes policy after years of artificially suppressed interest rates and how it will impact the yen carry trade.

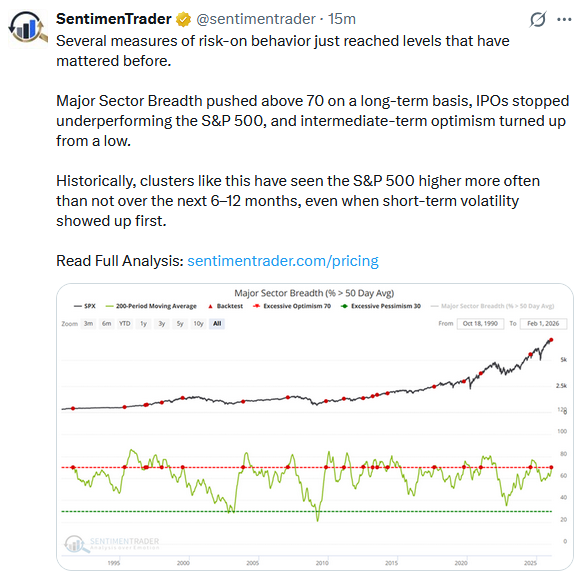
Tweet of the Day
More By This Author:
ISM Manufacturing Supports Reflationary Forecasts
Private Credit Funds Falling Out Of Favor
The Market Cycles Potentially Driving 2026 Returns
Disclaimer: Click here to read the full disclaimer.


