
Following futures positions of non-commercials are as of April 16, 2024.
10-year note: Currently net short 362k, down 144.8k.
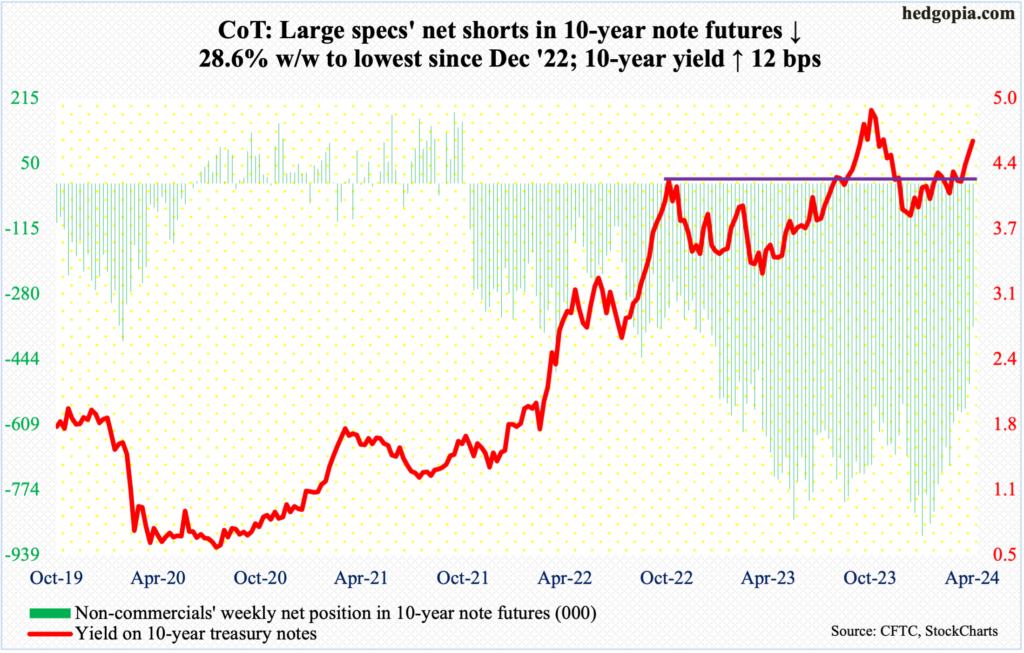
Last October, the 10-year treasury yield peaked at five percent, having rallied from 3.25 percent in April. In the week to October 24th, non-commercials were net short 563,362 contracts in 10-year note futures. They obviously thought the rates were not done going up and kept adding, eventually holding a record 889,385 contracts by January 16th; by then, the 10-year, having dropped to 3.79 percent in the last week of December, was beginning to stabilize.
Yields have particularly risen the last five weeks, from 4.04 percent on March 8th to Tuesday’s intraday high of 4.7 percent. This time around, these traders are not waiting. They have been actively locking in gains. From the mid-January high, net shorts are down 59 percent to this week’s 362,039 contracts.
From bond bulls’ perspective, in an ideal world, the ongoing short-covering should have put downward pressure on the 10-year yield. Or, maybe it did – a fact which just highlights the upward momentum in yields recently. If not for non-commercials’ short-covering, the 10-year would probably be already testing last October’s high. Now, there are signs of fatigue, with this week producing a shooting star and last week a spinning top.
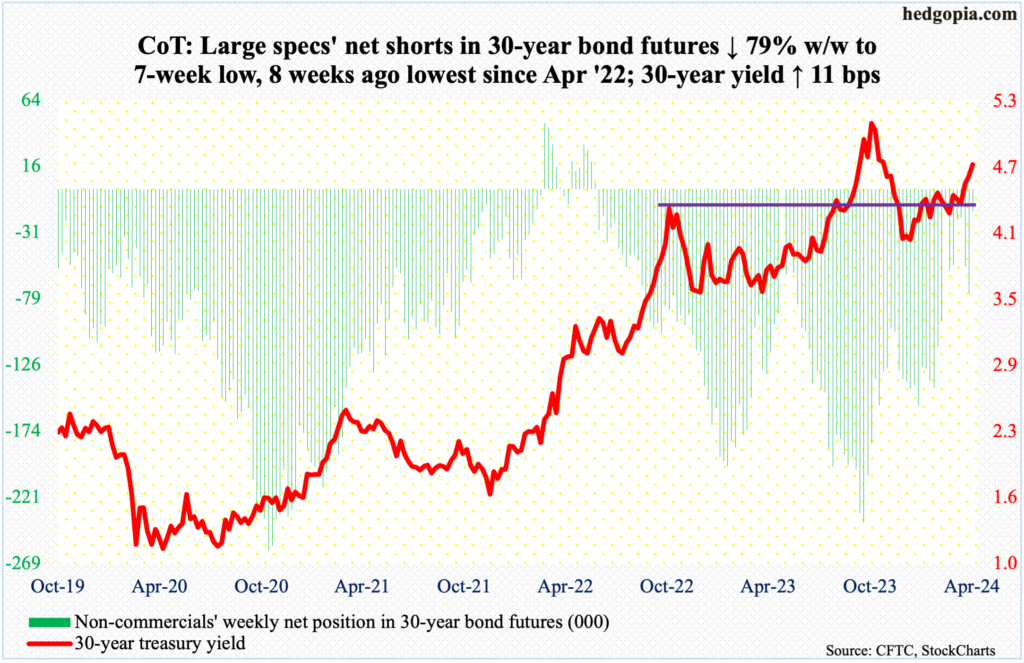
30-year bond: Currently net short 15.8k, down 59.4k.
Major US economic releases for next week are as follows.
New home sales (March) are due out Tuesday. February sales were down 0.3 percent month-over-month to a seasonally adjusted annual rate of 662,000 units – a two-month low.
On Wednesday, durable goods orders (March) will be published. Orders for non-defense capital goods ex-aircraft – proxy for business capex plans – increased 0.6 percent m/m to $73.9 billion (SAAR), not too far away from last November’s record $74 billion.
Thursday brings GDP (1Q24, 1st estimate). In 4Q23, real GDP grew 3.4 percent, which represents a sixth consecutive quarter of growth after back-to-back contraction in the first two quarters of 2022.
Personal income/spending (March) and the University of Michigan’s consumer sentiment index (April, final) are scheduled for Friday.
In the 12 months to February, headline and core PCE (personal consumption expenditures) rose 2.5 percent and 2.8 percent respectively. In 2022, they respectively grew at four-decade highs of 7.1 percent (June) and 5.6 percent (February).
April’s preliminary reading showed consumer sentiment slid 1.5 points m/m to 77.9. March’s 79.4 was a 32-month high.
WTI crude oil: Currently net long 300.1k, down 32.9k.

West Texas Intermediate crude had its back-to-back down week. On Friday last week, it ticked $87.67 intraday. This week, it rose as high as $86.18 on Tuesday, before ending the week down 3.8 percent to $82.22. Friday’s session was volatile with a high of $85.64 and a low of $81.13; in the end, traders decided the Israel-Iran conflict is not likely to spiral out of control – not yet anyway.
The crude has come a long way from last December’s bottom at $67.71. Traders will be particularly tempted to lock in profit if breakout retest at $81-$82 fails. WTI went back and forth between $71-$72 and $81-$82 for a year and a half before pushing through the upper end three weeks ago. The breakout is currently being tested.
In the meantime, US crude production in the week to April 12th was unchanged for six consecutive weeks at 13.1 million barrels per day; eight weeks ago, output was at a record 13.3 mb/d. Crude imports increased 27,000 b/d to 6.5 mb/d. As did crude inventory, which rose 2.7 million barrels to 460 million barrels. Stocks of gasoline and distillates, however, dropped 1.2 million barrels and 2.8 million barrels respectively to 227.4 million barrels and 115 million barrels. Refinery utilization dropped two-tenths of a percentage point to 88.1 percent.
E-mini S&P 500: Currently net long 74.1k, up 137k.
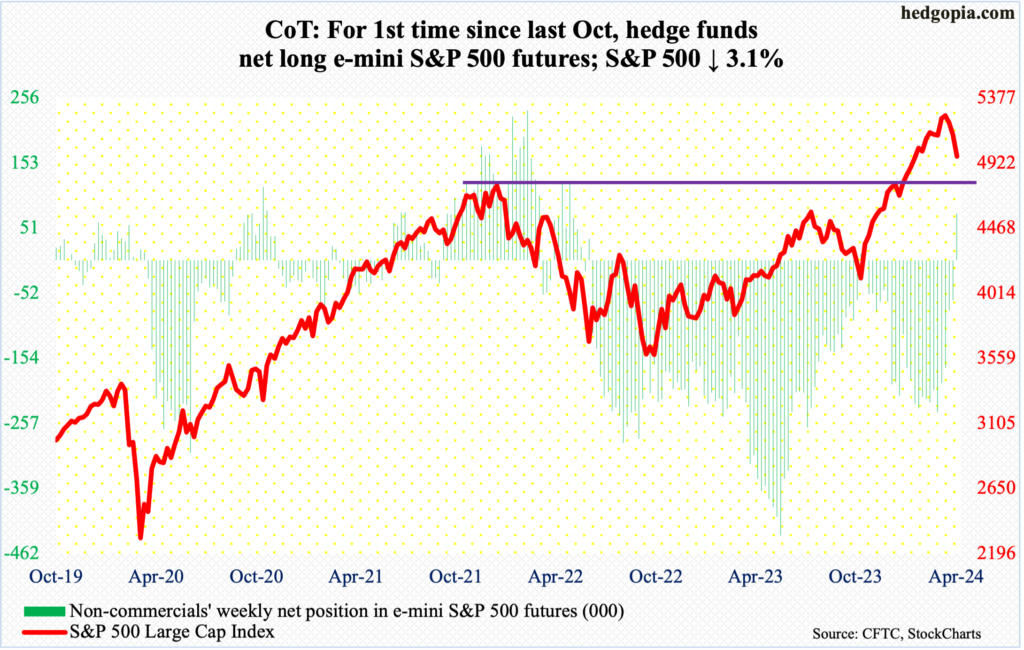
Non-commercials just switched to net long e-mini S&P 500 futures. They have not done so since last October when they were net long for only a couple of weeks; before that, they have not been net long since June 2022.
This is coming at a time when the cash is under pressure after having failed to bust out of 5260s in late March/early April. The S&P 500 peaked at 5265 on March 28th. This week, it shed 3.1 percent to 4967. After dropping for three weeks in a row, the large cap index is down 5.7 percent from last month’s high, which is nothing in the big scheme of things. From last October’s low, the index jumped 28.3 percent before weakening.
The daily is beginning to get oversold. If the weekly wins out, however, selling pressure can continue. In January, the S&P 500 surpassed its prior high of 4819 from January 2022. A breakout retest is just a matter of time. Should it take place right away, it is three percent away.
Euro: Currently net long 12.2k, down 20.5k.
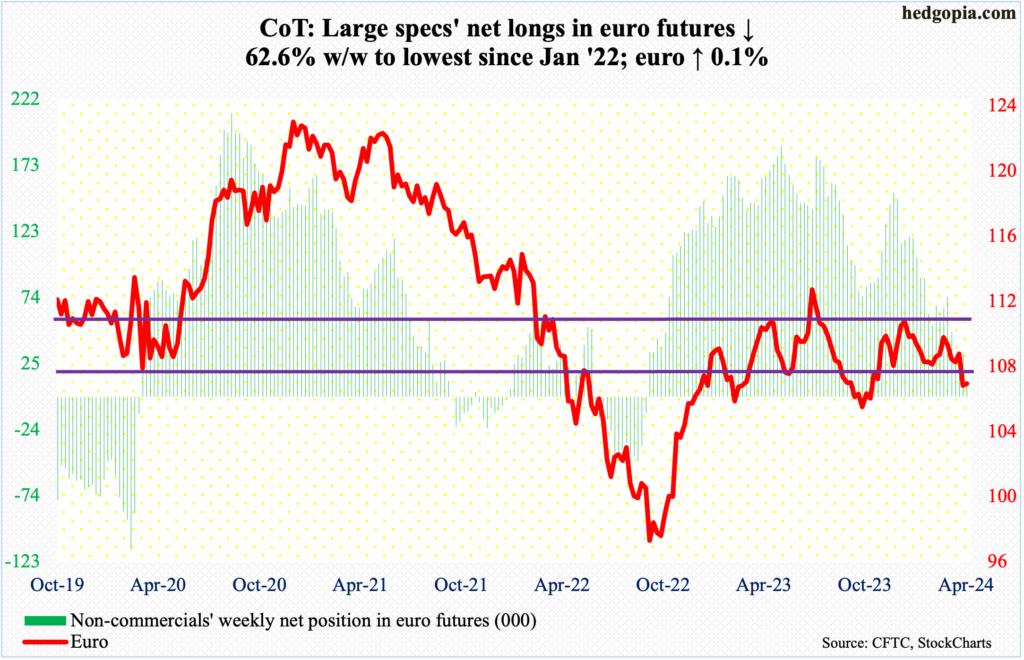
After gapping down last Friday to lose horizontal support at $1.07, the euro spent this week in damage-control mode. On Tuesday, it tagged $1.0601 before drawing bids. For the whole week, it rose 0.1 percent to $1.0656.
The currency has come under pressure since ticking $1.0981 on March 8th. Before that, it touched $1.1125 last December.
Immediately ahead, the aforementioned gap-down gets filled at $1.07. this is the one to watch for now. Inability to reclaim the level raises the odds of a move toward last October’s low of $1.0448.
Gold: Currently net long 201.9k, down 496.

Last Friday, gold printed a new intraday high of $2,449 but only to then reverse hard to close the session at $2,361. This behavior showed up after a vicious rally. Last October, the metal bottomed at $1,824 and tagged $2,047 as recently as March 1st. The Friday action could have set in motion a process of unwinding at least some of the overbought condition gold is in.
This week, gold did drop intraday Monday to $2,340 and that was it; the drop to the 10-day was bought, with the remaining four sessions just about trending higher all along the sharply-ascending average, ending the week up 2.2 percent to $2,414/ounce.
Non-commercials are in a wait-and-see mode, with net longs just north of 200,000 contracts in five of the last six weeks. They probably will start worrying if gold loses near-term support at $2,240s and most definitely if breakout retest at $2,080s fails. The yellow metal broke out of $2,080s early March.
Nasdaq (mini): Currently net long 8.5k, up 986.
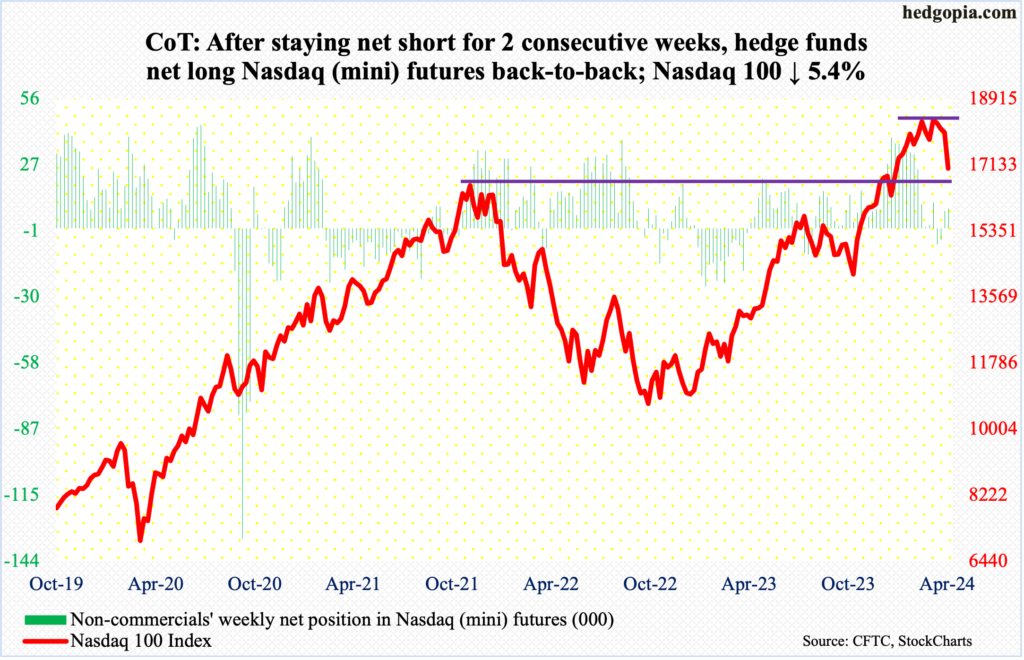
Last December, the Nasdaq 100 pushed through its prior high from November 2021. That 16765 breakout is being tested, as the tech-heavy index tagged 16964 intraday Friday. Earlier on March 21st the index posted a new intraday high of 18465.
After failing to sustainably break out of 18300s for seven weeks, the Nasdaq 100 crumbled this week, down 5.4 percent to 17038, with the week beginning with Monday’s breach of the 50-day. This preceded a breach a couple of weeks ago of a rising trend line from last October’s low.
The sector is behaving this way ahead of March-quarter results from US tech bigwigs in the next couple of weeks. Tesla (TSLA) reports next Tuesday, Microsoft (MSFT) and Google owner Alphabet (GOOG) on Thursday and Facebook owner Meta (META) on Wednesday. Apple (AAPL) and Amazon (AMZN) report the week after.
In the event of a rally, bulls need to recapture 17300s. A lack thereof exposes the index to a drop toward the 200-day (16267). The 50-day (17972) has been compromised.
Russell 2000 mini-index: Currently net short 38.5k, up 10.8k.
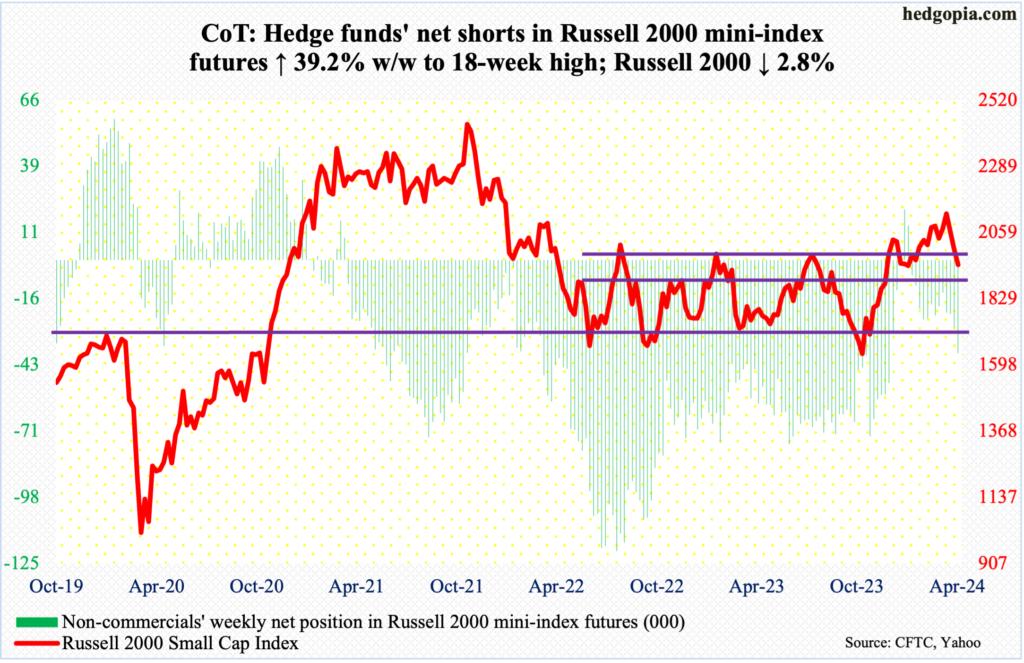
Last week, the Russell 2000 closed at 2003. Small-cap bulls, having failed to convincingly break out of 2100, were forced to defend 2000 and they failed. This week, the small cap index declined 2.8 percent to 1948. Ironically, this can be spun as good news by both bulls and bears. For the bulls, bids showed up Friday at 1932. For the bears, breakout retest at 1900 is still possible. On December 13th, the index broke out of a 1700-1900 range in place since January 2022.
US Dollar Index: Currently net short 929, down 213.
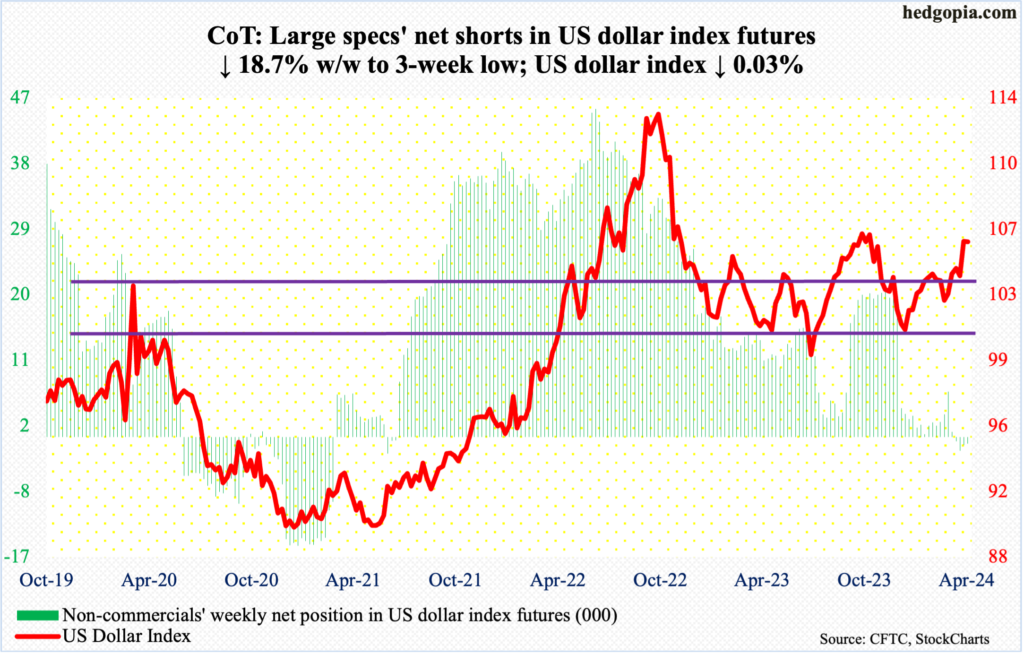
Dollar bulls tried to build on last week’s 1.9-percent jump in the US dollar index but did not quite pull it off. On Tuesday, the index tagged 106.33, but only to end the week at 105.98, down 0.03 percent.
This week’s action follows last week’s emphatic takeout of 103-104, which goes back to December 2016.
The bulls would still love to test 107, which between early October and early November last year rejected rally attempts several times.
VIX: Currently net short 22.5k, down 8.8k.
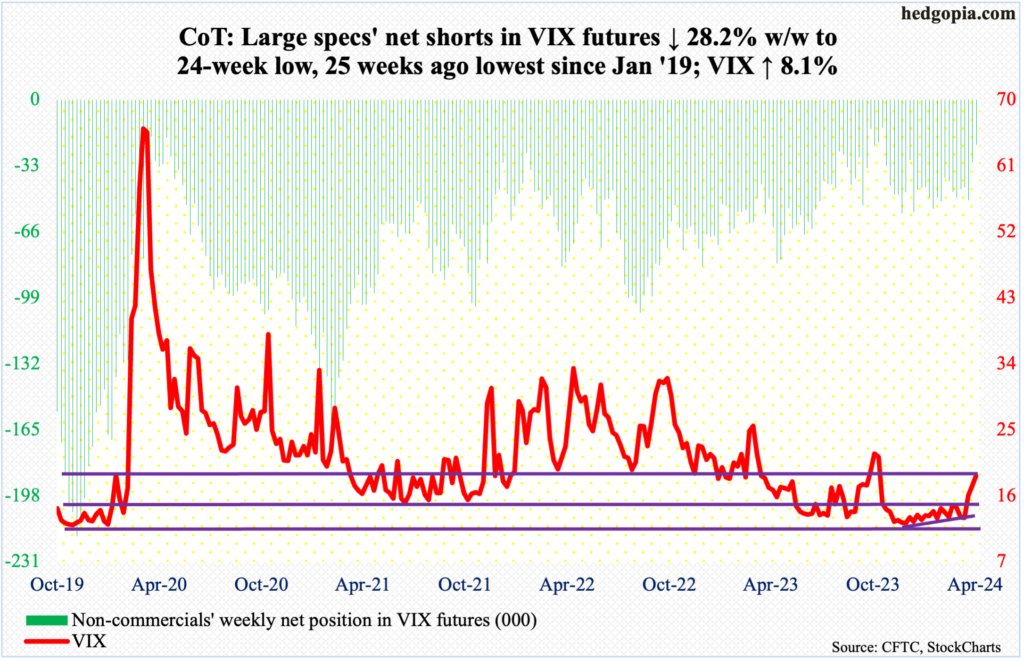
For the second week in a row, VIX rallied nicely but also ended with a weekly candle with a long upper shadow. Intraday Friday, the volatility index rallied as high as 21.36 but reversed to close at 18.71 – this in a session in which the S&P 500 dropped 0.9 percent, closing near the session low. Friday’s high was the highest since last October when VIX peaked at 23.08.
Concurrently, in the futures market, non-commercials are now only net short 22,474 contracts. Again, in the week to October 31st (last year), they cut their holdings to 13,979 before accumulating again. Historically, VIX has tended to peak as these traders go net long or get close to doing that.
Thanks for reading!
More By This Author:
S&P 500 And Nasdaq 100 Each Down Sub-3% From Recent Highs To End Right On 50-Day
Commitment Of Traders On Futures, Hedge Fund Positions
1Q24 Earnings Season Begins Amidst Collapse In Bearish Sentiment And More Or Less Sideways S&P 500


Comments
Log in or sign up to join the conversation.