
Over the last few years, a handful of “Mega-Capitalization” (mega-market capitalization) stocks have dominated market returns. The question is whether that dominance will continue and if the same companies remain the leaders. It is an interesting question. The number of publicly traded companies continues to decline, as shown in the following chart from Apollo.
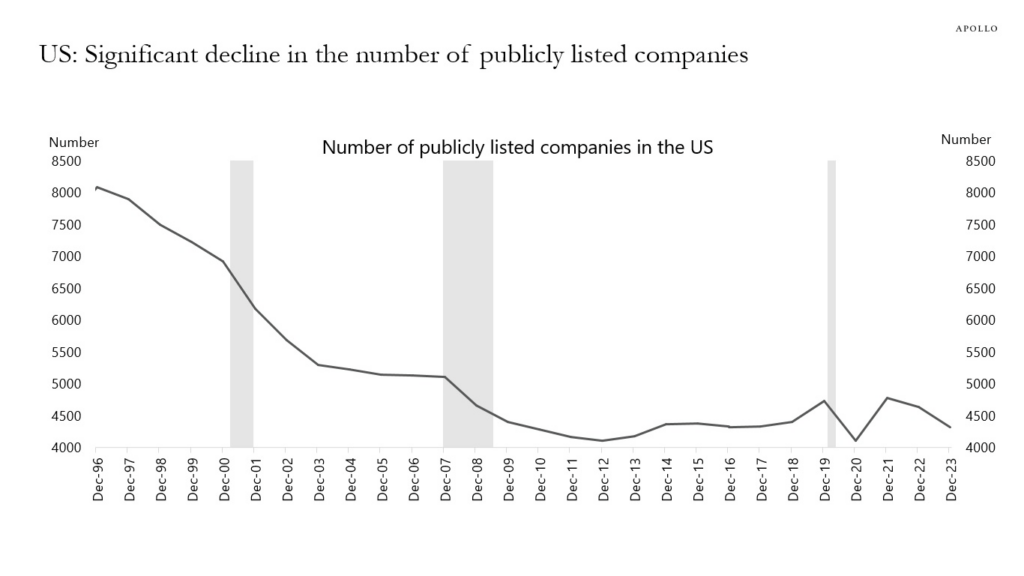
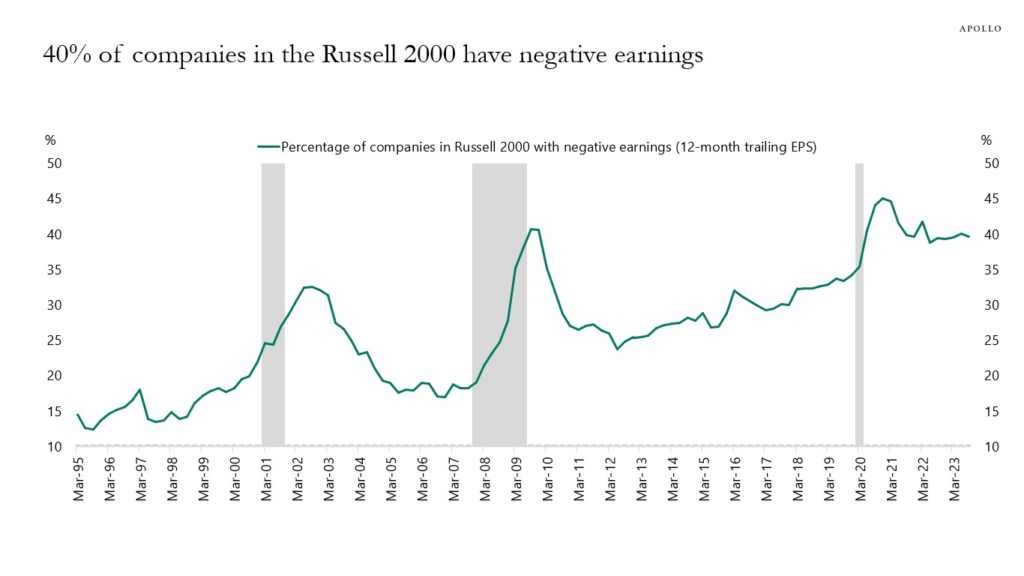
This decline has many reasons, including mergers and acquisitions, bankruptcy, leveraged buyouts, and private equity. For example, Twitter (now X) was once a publicly traded company before Elon Musk acquired it and took it private. Unsurprisingly, with fewer publicly traded companies, there are fewer opportunities as market capital increases. Such is particularly the case for large institutions that must deploy large amounts of capital over short periods. With nearly 40% of the companies in the Russell 2000 index currently non-profitable, the choices are limited even further.
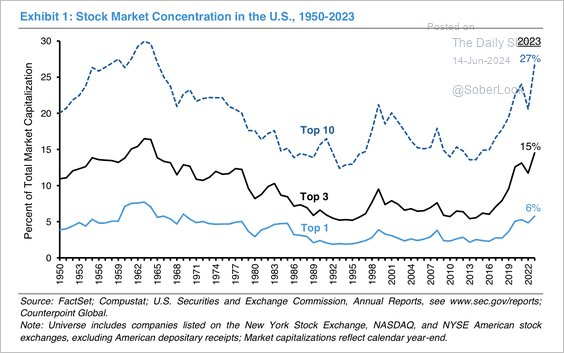
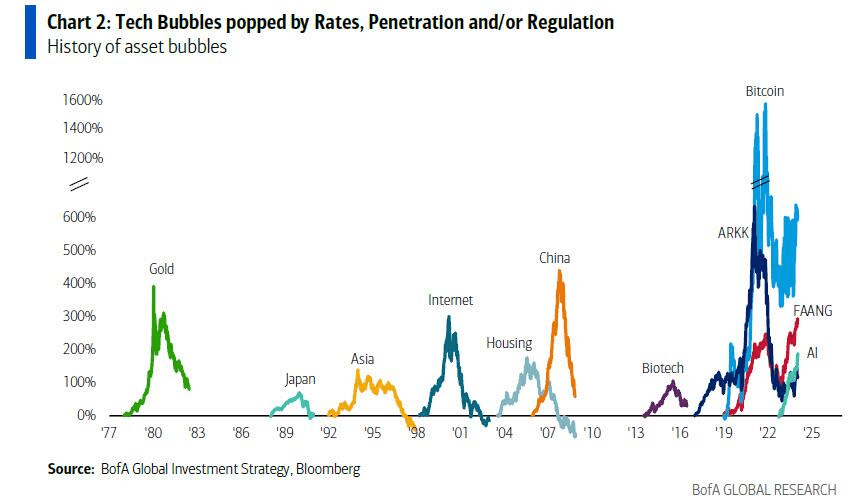
However, this period’s concentration of market capitalization into a few names is not unique. In the 1960s and 1970s, it was the “Nifty 50.” Then, in the late 90s, it was the “Dot.com” darlings like Cisco Systems. Today, it is anything related to “artificial Intelligence.”
As shown, the leaders of the past are not today’s leaders. Notably, Nvidia (NVDA) will get added to the list of the largest “mega-cap” companies for the first time in 2024.
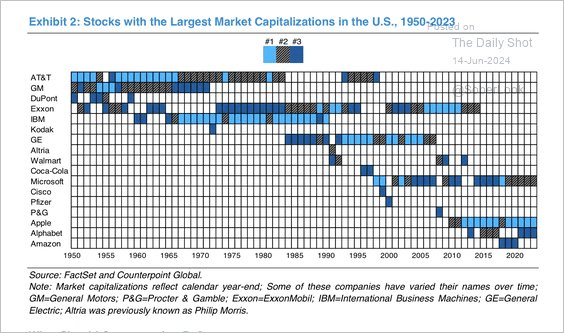
However, investors must decide whether Microsoft, Apple, Google, and Amazon will remain the leaders over the coming decade. Just as AT&T and GM were once the darlings of Wall Street, today’s Technology shares may become relics of the past.
Earnings Growth
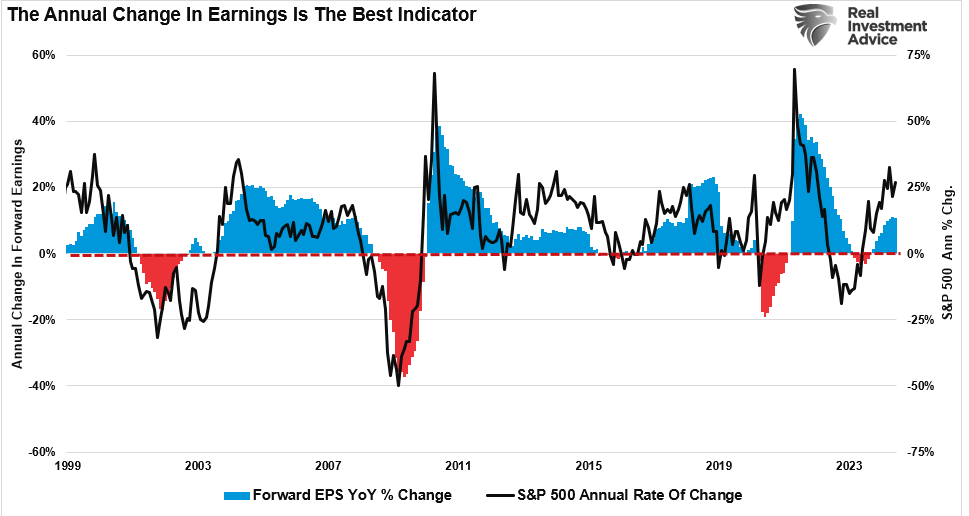
One primary determinant in answering that question is earnings growth. As should be obvious, investors are willing to pay higher prices when corporate earnings are growing.
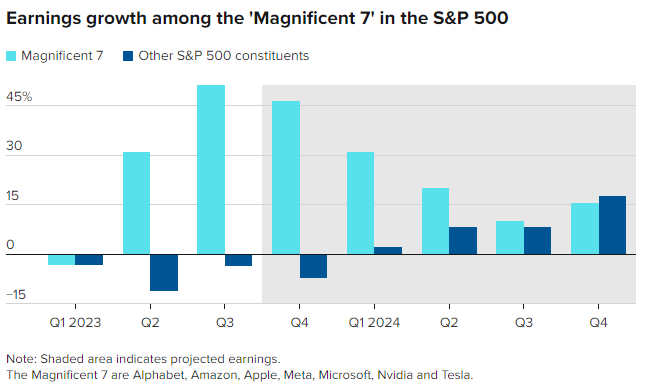
The problem is that in 2023, all the earnings growth came from the index’s top-7 “mega-capitalization” stocks. The S&P 500 would have had negative earnings growth excluding those seven stocks. Such would have likely resulted in a more disappointing market outcome. Notably, while analysts are optimistic that earnings growth for the bottom 493 stocks will accelerate into the end of 2024, with economic data slowing, those hopes will likely be disappointed.
Over the next decade, companies like Microsoft, Apple, and Alphabet will face the challenge of growing revenues fast enough to keep earnings growth rates elevated. Given that Nvidia is a relatively young company in a fast-growing industry, it has been able to increase revenues sharply to support higher valuation multiples.
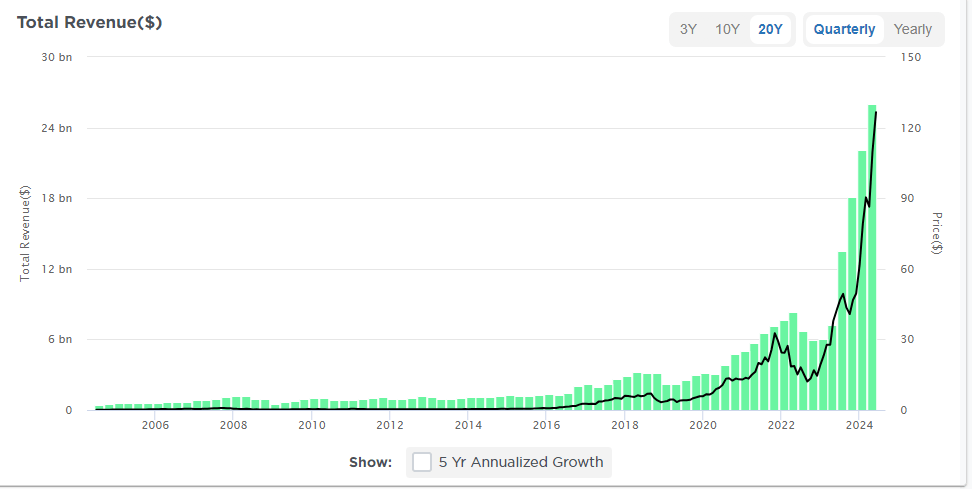
However, Apple, a very mature company, cannot grow revenues at such a high rate. Such is simply because of the law of large numbers. I have included a 5-year annualized growth rate of revenues to illustrate the issue better.
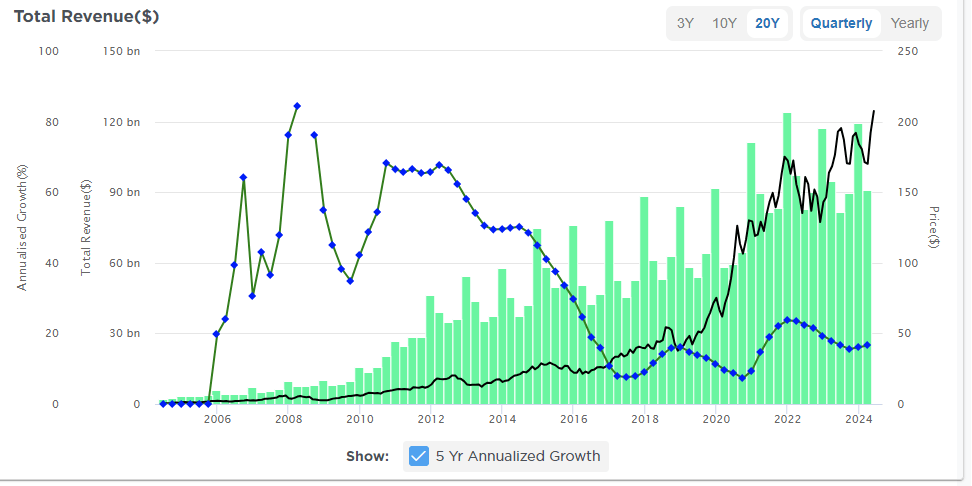
That is where the Wall Street axiom “Trees don’t grow to the sky” comes from.
In investing, it describes the danger of maturing companies with a high growth rate. In some cases, a company with an exponential growth rate will achieve a high valuation based on the unrealistic expectation that growth will continue at the same pace as the company becomes larger. For example, if a company has $10 billion in revenue and a 200% growth rate, it’s easy to think it will achieve 100s of billions in revenue within a few short years.
However, the larger a company becomes, the more difficult it becomes to achieve a high growth rate. For example, a firm with a 1% market share might quickly achieve 2%. However, when a firm has an 80% market share, doubling sales requires growing the market or entering new markets where it isn’t as strong. Firms also tend to become less efficient and innovative as they grow due to diseconomies of scale.
For this reason, many of today’s top market capitalization-weighted stocks may not be the same in a decade. Just as AT&T is a relic of yesterday’s “new technology,” such may be true with Apple a few years from now when no one needs a “smartphone” anymore.
Passive Investing’s Impact
Over the last two decades, the rise of passive investing has been another interesting change in the financial markets. As discussed previously, the top-10 “mega-capitalization” stocks in the S&P 500 index comprise more than 1/3rd of the index. In other words, a 1% gain in the top 10 stocks is the same as a 1% gain in the bottom 90%. As investors buy shares of a passive ETF, the ETF must purchase the shares of all the underlying companies. Given the massive inflows into ETFs over the last year and subsequent inflows into the top 10 stocks, the mirage of market stability is not surprising.
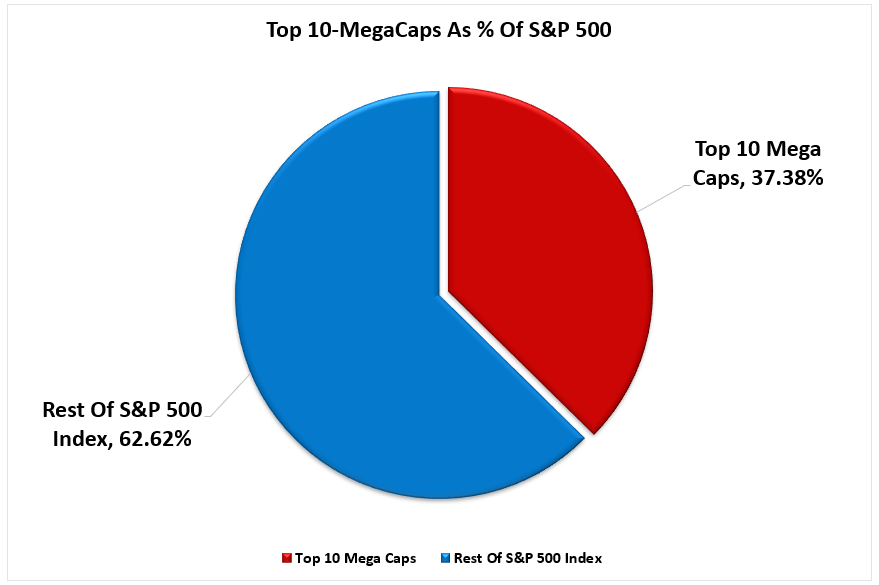
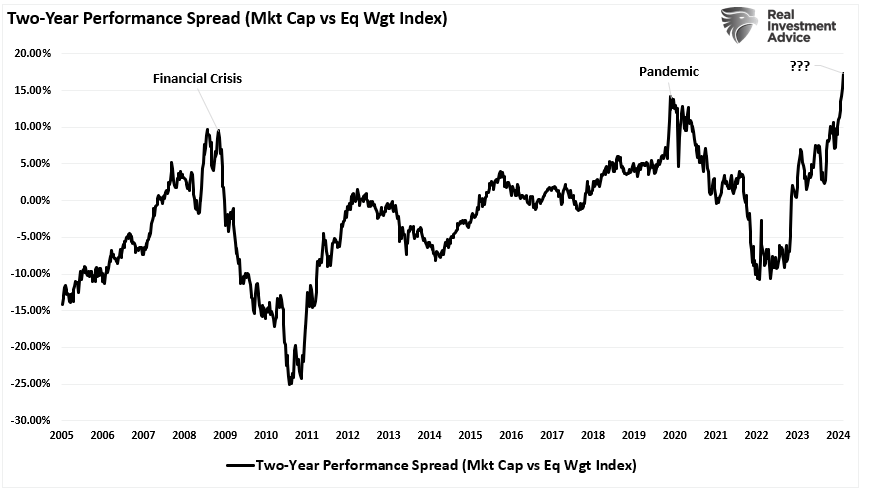
Unsurprisingly, the forced feeding of dollars into the largest weighted stocks makes market performance appear more robust than it is. That is also why the S&P 500 market-capitalization weighted index has outperformed the equal-weighted index over the last few years.
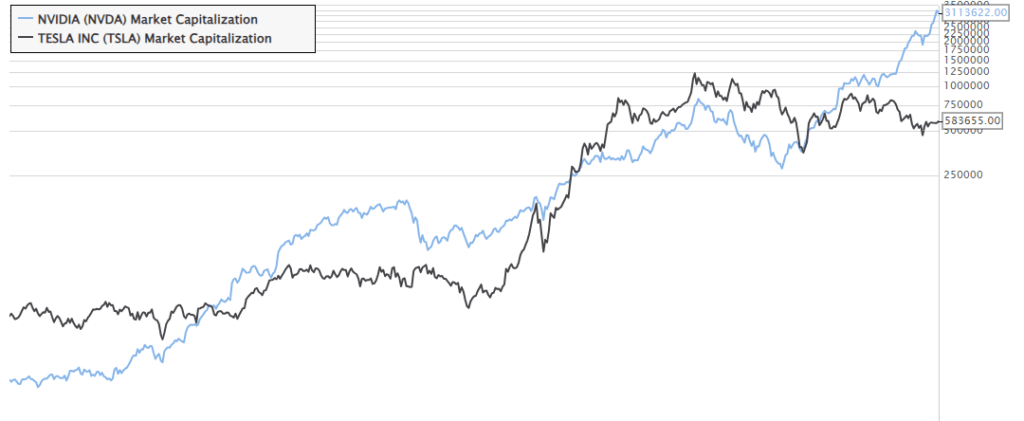
Investors often overlook this double-edged sword. For example, let’s assume that Tesla was 5% in the S&P 500 index before Nvidia entered the top 10. As Nivida’s rapid share price increased its market capitalization, Tesla’s was reduced as its stock price fell. Therefore, all index funds, passive fund managers, portfolio managers, etc., had to increase their weightings in Nvidia and reduce their ownership in Tesla.
In the future, whatever the next generation of companies garners Wall Street’s favor, the current leaders could fall out of the top 10 as the “passive” flows require additional selling of today’s leaders to buy more of tomorrow’s.
Share Buybacks
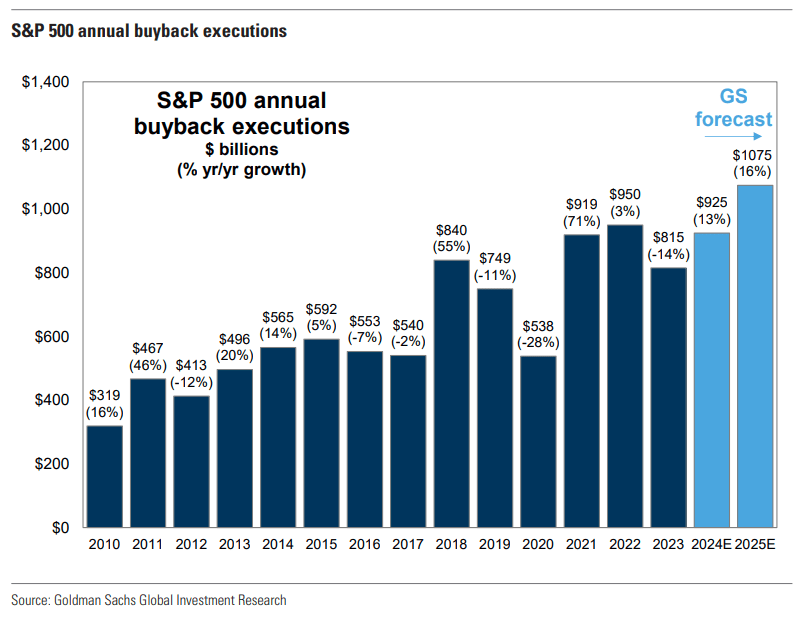
Lastly, corporate share buybacks, expected to approach $1 trillion and exceed that in 2024, could weigh on current leadership. That is because the largest companies with the cash to execute large multi-billion dollar programs, like Apple, Microsoft, Alphabet, and Nvidia, dominate buybacks. For example, Apple alone will account for over 10% of 2024 buybacks.
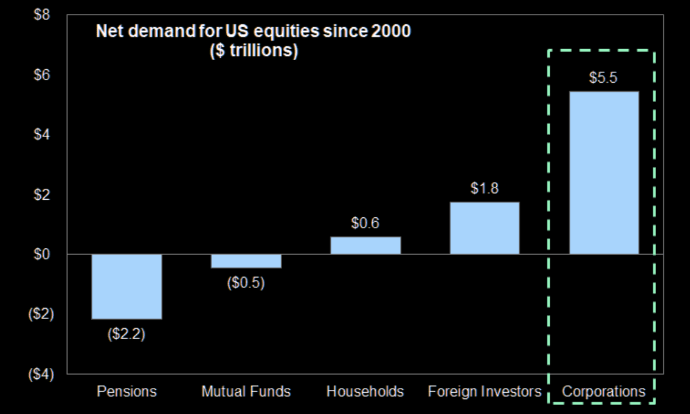
If you don’t understand the importance of share buybacks in maintaining the largest companies’ current market dominance, here is some basic math.
- Pensions and MF = (-$2.7 Trillion)
- Households and Foreign = +$2.4 Trillion
- Sub Total = (-$0.3 Trillion)
- Corporations (Buybacks) = $5.5 Trillion
- Net Total = $5.2 Trillion
In other words, since 2000, corporations have provided 100% of all the net equity buying.
Therefore, it should be unsurprising that there is a high correlation between the ebbs and flows of corporate share buybacks and market performance.
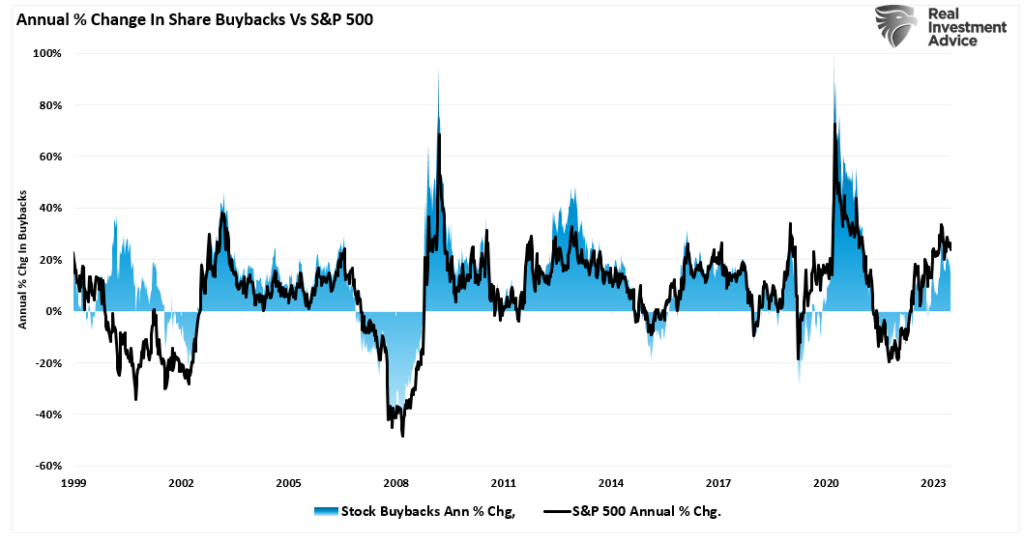
Therefore, as long as corporations remain the top buyers of their shares, the current dominance of the “Mega-caps” will continue. Of course, there are reasons the current rate of corporate share repurchases will end.
- Changes to the tax code
- A ban on share repurchases (they were previously illegal due to their ability to manipulate markets)
- A reversal of profitability, making share repurchases onerous.
- Economic recession/credit event where corporations go on the defensive (i.e., 2000, 2008, 2022)
Whatever the reason, the eventual reversal of buyback programs could severely limit the current leader’s market dominance.
I have no clue what event causes such a reversal or when. However, a reversal could undo mega-cap dominance since corporate share buybacks have provided all the net equity buying for the largest stocks.
Conclusion
The current dominance of the largest “Mega-capitalization” companies is unsurprising. As noted, they make up the bulk of earnings growth and revenues of the S&P 500 index, the largest purchasers of their shares. These are also the same companies in the middle of the current “Artificial Intelligence” revolution, as has been the case for the last decade.
However, given the speed at which technology and the economy rapidly change, such suggests that leaders of the last decade may not be the leaders of the next.
As investors, it is vital to understand the dynamics of each market cycle and invest accordingly. However, those buying stocks today at some of the most extreme valuations we have seen over the last century and expecting those shares to dominate over the next decade could be disappointed.
Many variables support the current secular bull market cycle. However, as has been the case throughout history, a myopic approach to investing has led to poor outcomes.
Invest accordingly.
More By This Author:
What Can We Expect When The Fed Cuts RatesGoldman Sachs Makes A Case For A July Cut
The UM Sentiment Survey Confirms Consumer Jitters


Comments
Log in or sign up to join the conversation.