

Falling inflation, weak manufacturing activity, cautious consumer sentiment, and sluggish GDP and jobs growth have conspired to elicit a dovish tone from the Federal Reserve and the likely start of a rate cut cycle to avert recession and more jobs losses. I continue to pound the table that the Fed is behind the curve and should have begun to cut at the July meeting.
Why? Well, here are my key reasons:
1. Although official inflation metrics still reflect lingering “stickiness” in consumer prices, my research suggests that real-time inflation is already well below the Fed’s 2% target, as I discuss in detail in today’s post.
2. Last week’s BLS jobs report shows 66,000 fewer employed workers in August 2024 versus 12 months ago after massive downward revisions to prior reports. And if you dig deeper into the August household survey it gets worse, indicating a whopping 1.2 million fewer full-time jobs (yikes!), partially offset by a big growth in part-time jobs.
3. The mirage of modest GDP and jobs growth has been temporarily propped up by unhealthy and inefficient government deficit spending (euphemistically called “investment”) rather than true and sustainable organic growth from a vibrant private sector that is adept at efficient capital allocation. Thus, despite government efforts to “buy” growth, recessionary signals are growing at home and abroad.
4. The burden caused by elevated real interest rates on surging debt across government, business, consumers at home and emerging markets abroad, and the impact of tight monetary policy and a relatively strong dollar on our trading partners must be confronted.
So, a 50-bps cut at the September FOMC meeting next week seems warranted—even if it spooks the markets. As Chicago Fed president Austan Goolsbee said, “You only want to stay this restrictive for as long as you have to, and this doesn’t look like an overheating economy to me.”
A terminal fed funds neutral rate of 3.0-3.5% seems appropriate, in my view, which is roughly 200 bps below the current range of 5.25-5.50%). Fortunately, today’s lofty rate means the Fed has plenty of potential rate cuts in its holster to support the economy while remaining relatively restrictive in its inflation fight. And as long as the trend in global liquidity is upward (which it is once again), then it seems the risk of a major market crash is low.
Regarding the stock market, as the Magnificent Seven (MAG-7) mega-cap Tech stocks continue to flounder, markets have displayed some resilience since the cap-weighted S&P 500 and Nasdaq 100 both topped in mid-July, with investors finding opportunities in neglected market segments like financials, healthcare, industrials, and defensive/higher-dividend sectors utilities, real estate, telecom, and staples—as well as gold (as both a store of value and protection from disaster). However, economic weakness, “toppy” charts, and seasonality (especially in this highly consequential election year) all suggest more volatility and downside ahead into October.
Of course, August was tumultuous, starting with the worst one-day selloff since the March 2020 pandemic lockdown followed by a moon-shot recovery back to the highs for the S&P 500 (SPY) and S&P 400 MidCap (MDY), while the Dow Jones Industrials (DIA) surged to a new high. However, the Nasdaq 100 (QQQ) and Russell 2000 SmallCap (IWM) only partially retraced their losses. And as I said in my August post, despite the historic spike in the CBOE Volatility Index (VIX), it didn’t seem like the selloff was sufficient to shake out all the weak investors and form a solid foundation for a bullish rise into year end. I said that I expected more downside in stocks and testing of support before a tradeable bottom was formed, especially given uncertainty in what the FOMC will do on 9/18 and what the elections have in store.
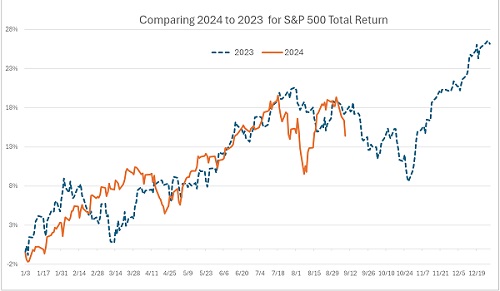
In addition, September is historically the worst month for stocks, and October has had its fair share of selloffs (particularly in presidential election years). And although the extraordinary spike in fear and “blood in the streets” in early August was fleeting, the quick bounce was not convincing. The monthly charts remain quite extended (“overbought”) and are starting to roll over after August’s bearish “hanging man” candlestick—much like last summer. In fact, as I discussed in my post last month, the daily price pattern for the S&P 500 in 2024 seems to be following 2023 to a T, which suggests the weakness (like last year) could last into October before streaking higher into year end. Anxiety around a highly consequential election on 11/5 (with counting of mail-in ballots likely to last several days beyond that once again) will surely create volatility.
Many commentators believe the Fed is making a policy mistake, but it goes both ways. Some believe the Fed is turning dovish too quickly because inflation is sticky, the jobs market is fine, and GDP is holding up well, so it risks reigniting inflation. Others (like me) think the FOMC is reacting too slowly because the economy, jobs growth, and inflation are weaker than the mirage they seem, masked by inordinate government deficit spending, misleading headline metrics, and political narratives. As Fed Chair Jerome Powell said at the July meeting, “The downside risks to the employment mandate are now real,” and yet the FOMC still chose to hold off on a rate cut. Now it finds itself having to commence an easing cycle with the unwanted urgency of staving off recession rather than a more comfortable “normalization” objective within a sound economy.
Indeed, now that we are past Labor Day, it appears the “adults” are back in the trading room. As I discuss in detail in today’s post, economic metrics seem to be unraveling fast, stocks are selling off, and bonds are getting bought—with the 2-10 yield curve now “un-inverted” (10-year yield exceeds the 2-year). So, let’s get moving on rate normalization. After all, adjusting the interest rate doesn’t flip a switch on economic growth and jobs creation. It takes time for lower rates and rising liquidity to percolate and reverse downward trends, just as it took several months for higher rates and stagnant liquidity to noticeably suppress inflation. Fed funds futures today put the odds of a 50-bps cut at about 27%.
Nevertheless, stock prices are always forward-looking and speculative with respect to expectations of economic growth, corporate earnings, and interest rates, so prices will begin to recover before the data shows a broad economic recovery is underway. I continue to foresee higher prices by year end and into 2025. Moreover, I see current market weakness setting up a buying opportunity, perhaps in October. But rather than rushing back into the MAG-7 stocks exclusively, I think other stocks offer greater upside. I would suggest targeting high-quality, fundamentally strong stocks across all market caps that display consistent, reliable, and accelerating sales and earnings growth, positive revisions to Wall Street analysts’ consensus estimates, rising profit margins and free cash flow, solid earnings quality, and low debt burden. These are the factors Sabrient employs in selecting the growth-oriented Baker’s Dozen (our “Top 13” stocks), the value-oriented Forward Looking Value, the growth & income-oriented Dividend portfolio, and Small Cap Growth, which is an alpha-seeking alternative to a passive position in the Russell 2000.
We also use many of those factors in our SectorCast ETF ranking model. And notably, our Earnings Quality Rank (EQR) is a key factor in each of these models, and it is also licensed to the actively managed, absolute-return-oriented First Trust Long-Short ETF (FTLS) as an initial screen. Each of our alpha factors and their usage within Sabrient’s Growth, Value, Dividend, and Small Cap investing strategies is discussed in detail in Sabrient founder David Brown’s new book, How to Build High Performance Stock Portfolios, which will be published shortly.
In today’s post, I discuss in greater detail the current trend in inflation, Fed monetary policy, and what might lie ahead for the stock market as we close out a tumultuous Q3. I also discuss Sabrient’s latest fundamental-based SectorCast quantitative rankings of the ten U.S. business sectors, current positioning of our sector rotation model, and several top-ranked ETF ideas. And be sure to check out my Final Thoughts section with some political comments—here’s a teaser: Democrats have held the presidency for 12 of the past 16 years since we emerged from the Financial Crisis, so all these problems with the economy, inflation, immigration, and global conflict they promise to “fix” are theirs to own.
Market Commentary
It is often argued that a tax cut without a corresponding reduction in spending only serves to increase the budget deficit and add to the federal debt, thus passing the bill to the next generation. But as the folks at DataTrek have observed, “Regardless of individual and corporate tax rates, federal receipts have averaged 17% of GDP since 1960. Economic growth is the only reliable way to increase government revenues.” This suggests that lower taxes shift capital from the public sector to the private sector, which has proven itself much more adept at creating return on capital through efficient capital allocation rather than malinvestment and boondoggles of Big Government making top-down selections of winners and losers, like a politburo.
The reality is that truly organic economic growth equates to faster and more sustainable GDP growth than government-directed “investment” (i.e., spending bills, including boondoggles and “crony capitalism”) written by politicians (and their donors/lobbyists). It also equates to rising earnings and taxable income—and faster growth in tax receipts. (This works well as long as companies use their tax savings to grow the business through capital spending and hiring rather than only for share buybacks, which only benefits shareholders.) So, even if spending is not cut but simply held steady, the budget deficit and total debt should fall with lower tax and interest rates.
Therefore, rather than instituting high tax rates to fund the government and then stimulating the economy through deficit spending and monetary inflation (by flooding the financial system with liquidity), it is much more effective to keep tax rates at a modest level that provides the private sector with more working capital while keeping the money supply growing at a rate in line with the resulting organic economic growth rate. Velocity of money supply will ebb and flow a bit to offset minor policy mistakes, so the Fed doesn’t need to thread-the-needle on liquidity. But it should seek to incentivize lending--not by paying banks a high interest rate to hold reserves at the Federal Reserve, as is done today with the Fed’s “abundant reserves” policy, but rather with traditional “scarce reserves” policy.
The biggest hurdle to all of this is that politicians always seem to believe that their role in the world is to “fix” problems by throwing more money at them (and then creating new oversight boards—also on the taxpayer dole—to administer them!). To be fair, this is what the electorate often expects of them (“Do something!”). But as President Reagan once said, “The nine most terrifying words in the English language are: I’m from the government and I’m here to help.” It’s a surefire path to waste, distortion, division, and inefficiency.
Rather than relying on government spending on favored sectors, which inevitably creates only lackluster economic growth at best, the free market is best poised to decide what merits investment for the greatest returns and benefits. An expectation of high returns on capital spending means there are lots of willing buyers eagerly awaiting the production that comes from that spending—unlike today’s government subsidies which only distort markets. Government’s best role in the economy is as “referee” to enforce the rules of the game. Surely the poor outcomes (including low standards of living and oppression of individual rights) of every socialist system in history proves this point.
There are only three ways to dig our way out of this enormous pile of debt: cut spending, “inflate away” the debt, or grow our way out of debt. But I believe it will require a combination of all three as such:
1. Reduce government spending and intervention to turn our budget deficit into a surplus through smaller government and restraints on spending and regulation (“red tape”).
2. Maintain a modest rate of inflation (2-3%) to devalue the debt by making the dollars owed worth less over time without crippling consumers today.
3. Foster solid, sustained, organic economic growth, led by the private sector and supported by low tax rates for all, as robust economic growth generates greater tax receipts (remember, 17% of GDP on average over time) and more opportunities and prosperity for everyone.
This approach puts money back in the pockets of consumers and businesses and loosens the reins to unleash innovation, R&D, and capital investment; foster robust commerce, competition, and the most efficient use of capital; and ultimately generate better profit margins, higher earnings, disinflation (through productivity and efficiency), and stronger GDP growth—leading to higher tax receipts (more than offsetting the lowered tax rates). It’s also good for gold and commodities, which may be entering a “Supercycle.”
But it really depends not just on who becomes president but also on the make-up of Congress and whether onerous tax and regulatory policies are rammed through that hinder corporations, small businesses, and entrepreneurs across the board—or whether they are given the freedom to invest, innovate, grow, hire, and prosper.
Regardless, I expect higher stock prices by year end and into 2025 (no matter who wins the election) as the Fed brings interest rates down and global liquidity rises. Keep in mind, rate cuts are implemented not simply by decree but also by injecting liquidity into the banking system (by buying securities) to increase the money supply available to lend, including through the Fed’s open market operations (OMO).
Inflation, employment, and Fed policy:
This week will reveal August PPI and CPI reports on 9/11-12, followed by the FOMC meeting on 9/17-18. So, let’s look back at the July readings, including Personal Consumption Expenditures (PCE), aka consumer spending. In the graphic below, the upper chart compares the trends since June 2021 in PPI, CPI, Core CPI, and Core PCE (“core” means that it excludes the volatile food & energy components). PPI cratered to nearly zero in June 2023 but then chopped around since then. Similarly, headline CPI essentially went sideways since June 2023. However, Core CPI and Core PCE have maintained a consistent downward trend from their September 2022 highs, and over the past couple of months, the headline versions have been falling in tandem with the core versions. July PPI was +2.27% year-over-year (YoY), CPI was +2.92%, and Core CPI was +3.21%. The Fed's preferred inflation metric is Core PCE, which came in at +2.62% for July.
However, these YoY readings are skewed by one-time items like the big reset in insurance premiums at the start of the year—I can tell you that my auto and homeowners premiums spiked by a shocking amount. And every monthly comparison to the same month last year is going to be impacted by that one-time price hike until Q1 2025. Moreover, it seems to me that inflation in other items is no longer going up as fast. So, to get a better read on the current inflation trend, one might look at the annualized month-over-month (MoM) price changes, but that can be quite volatile for a single month, so I prefer to watch the rolling 3-month annualized average of MoM readings, as shown in the lower chart. You can see that annualized 3-month Core PCE fell to +1.72% in July, while 3-month Core CPI fell to +1.58%, 3-month headline CPI at just +0.42% (!), and 3-month PPI fell to +1.19%. So, the current trend is much better than looking back 12 months (before the insurance reset).

However, I have always been skeptical of numbers presented to me, even from supposedly objective sources. I think it’s the analytical bent I was born with (which can be quite annoying to my wife) along with my engineering training and experience and my years applying the bulletin board test (aka “smell test”) to studies run by my analyst colleagues through the years. As Mark Twain once said, “Lies, damn lies, and statistics.” You can create “truthful” metrics to effectively support any argument or position. The Fed has been basing its monetary policy primarily on metrics calculated by federal agencies regarding inflation, jobs growth, and GDP. But headline numbers be illusory…the devil is in the details—particularly our overreliance on government deficit spending. So, I like to look beyond the headline numbers to discover what really might be going on.
One such alternative inflation metric I recently came across is “Harmonized Index of Consumer Prices” (HICP), which is a European method of accounting for inflation across countries in the EU. As such, it was designed to facilitate international comparisons of consumer price inflation. The U.S. Bureau of Labor Statistics (BLS, in the Department of Labor) began calculating a US version of the index as a research project in 2006. Compared to CPI, there are two main differences. First, HICP includes rural populations while CPI focuses solely on urban areas, and second, HICP excludes the fictitious concept of owners' equivalent rent (OER) and replaces it with the true cost of owner-occupied housing (e.g., price of home acquisition, repairs, and improvements). The July reading for HICP came in at +1.72% YoY, and the rolling 3-month annualized reading was just +0.85%.
So, as illustrated in the lower chart above, all five of the annualized 3-month metrics are well below the Fed's 2% target. In addition, the real-time, blockchain-based "Truflation" metric (which is published daily and historically presages CPI by several months) just hit a new all-time low of +1.17% (as of 9/9).
Regardless, some political opportunists today are trying to suggest that the inflation problem was caused by greedy businesses “price-gouging” vulnerable consumers, so they propose to institute close monitoring (another government oversight board!) and harsh penalties. But the econ team at First Trust has pointed out that inflation only became a global phenomenon in the wake of the pandemic, with strong correlation to the massive global liquidity injections (i.e., money supply growing far faster than GDP growth). As First Trust opines, “Ultimately, the best way to fight inflation is to have the Fed focus on price stability while the government minimizes taxes and regulation to encourage competition and risk-taking. Competition, not new regulations, is the way to keep prices down.”
Other central banks around the world are already starting to cut rates and inject liquidity—with perhaps as much as $2 trillion on the way by some estimates. Already, total global liquidity recently hit an all-time high of about $175 trillion, according to economist Michael Howell of CrossBorder Capital. This suggests greater access to capital around the world, which likely will induce rising demand for risk assets like equities and high-yield bonds. Indeed, Howell reminds us that the best time for investors is when policymakers are trying to stimulate sluggish economies.
The Fed will be the last major central bank in the West to begin an easing cycle. As famed investor Jim Paulsen espoused, "This is the first post-war bull market where the Fed has maintained tight policy throughout its entire duration. Typically, the Fed begins easing even before the bull market takes off. In a sense, the Fed is resetting the clock on this bull run by its latest actions."
Deteriorating jobs and economic metrics:
Last Friday’s BLS nonfarm payroll (jobs) report for August showed continued weakness, falling short of expectations. Although the unemployment rate fell slightly to 4.2% from 4.3% in July (the highest since October 2021), there were fewer new hires than expected and a continued trend of downward revisions to the June and July reports—so, while 118,000 new jobs were added (although it seems inevitable it will be revised down next month), June and July were revised down by 86,000 total, largely offsetting August’s gains.
Most shocking was the -818,000 downward revision to new jobs created during the April 2023 through March 2024 period (the biggest negative revision since 2009), suggesting the reports have been overstating the strength of the job market. Indeed, we continue to see consistently downward revisions to prior monthly jobs reports (which smells of deliberate manipulation)—and a notable overdependence on government-created jobs rather than organic private-sector growth. For example, the August jobs report showed 24,000 new government jobs and 24,000 fewer manufacturing jobs. As the econ team at First Trust recently opined, “We are worried that we have come very close to state-run capitalism. In the past year, 82% of all net new jobs have been in government, healthcare and education.”
There has also been an increasing skew toward growth in part-time jobs while full-time jobs are falling. In fact, digging deeper into the August household survey (within the BLS jobs report) shows 66,000 fewer employed workers than in August 2023, but there are 609,000 more “”part-time for economic reasons” and 531,000 more “part time for noneconomic reasons”—which implies a whopping 1.2 million fewer full-time jobs versus 12 months ago.
Moreover, August ADP private payrolls showed the smallest monthly hiring growth since in 3.5 years at just 99,000 versus an expectation of 145,000, marking five straight months of MoM slowing. The latest BLS JOLTS report showed that July closed with the fewest number of job openings since January 2021 and the ratio of job openings to unemployed persons seeking work fell to 1.1, which is below pre-pandemic levels.
The New York Fed consumer expectations survey showed fear of becoming unemployed in the next four months at the highest level since 2014. The University of Michigan survey section regarding expected changes in household income is nose-diving. The Conference Board Consumer Confidence survey showed that its labor differential gauge continues to deteriorate.
What else is weakening besides inflation, jobs growth, and consumer sentiment? Well, construction spending is down, led by falling homebuilding activity, and while the jobs report showed construction jobs at an all-time high, the JOLTS report showed construction job openings and housing starts are in freefall. The ISM Manufacturing Index for August declined yet again to 47.2 and remains in contraction (below 50) for 21 of the last 22 months. Most notably, the new orders component is at its lowest level since May 2023 and has been in contraction for 22 or the last 24 months, while order backlogs have been contracting for 23 straight months, and the production index is at its lowest level since the pandemic lockdowns, leading to worker furloughs and a contractionary employment index. The ISM Services Index for August reflected stagnant activity and a slowdown in hiring, with the employment component falling once again.
Furthermore, the Fed’s Summary of Commentary on Current Economic Conditions (aka “Beige Book”) revealed that economic activity is flat or falling in 9 of its 12 districts, with heightened concerns about economic activity and recession rather than inflation. Moreover, WTI crude oil price fell below $70/bbl to a new 52-week low, which is disinflationary (good) but also recessionary (bad); the important industrial metal copper (CPER) has weakened substantially after surging in May; and the Invesco Commodity ETF (DBC) just set a new 52-week low.
I can go on. Core shipments of durable goods fell in July for the third consecutive month and have fallen substantially since the pandemic-era PPP loans and stimulus payments. New Chapter 11 bankruptcy filings have surged to the highest since 2012. Commercial real estate foreclosures have surged. Real retail sales have been essentially flat for 3 years. Credit card delinquencies continue to rise, and credit card defaults are at record levels--even higher than during the Financial Crisis.
And don’t overlook the economic struggles in China, with a worse-than-expected slowdown in the PMI Manufacturing (also suggestive of falling energy demand), and as unemployment continues to climb (with youth unemployment surging above 21%), GDP growth slows (4.7% in Q2), and public unrest builds. Although Chairman Xi has been adamantly against new stimulus measures (that would add more debt for his “house of cards” economy), he had no choice but to let the PBoC begin injecting liquidity via interest rate reductions and reverse repos, and likely will need much more.
Stock valuations:
Below is an update to last month’s chart showing how the 2024 stock market (thru 9/6) is looking a lot like 2023. Of course, while 2023 began on the heels of the 2022 bear market, 2024 commenced amid the AI-driven, Tech-led optimism and the promise of immense productivity growth, rising earnings, falling inflation, and a supportive Fed. So, while the macro climate was quite different entering this year, the S&P 500 continues to track quite similarly to 2023. If it continues this way, we might expect further downside (and better prices) yet to come, perhaps with the ultimate buying opportunity arriving in October—or perhaps in early November, given election uncertainty (and anxiety).
A cautionary message comes from the so-called “Buffett Indicator,” named of course for Warren Buffett of Berkshire Hathaway (BRK.B). He believes that stocks are oversold when the ratio of total market capitalization to GDP moves too far above the long-term mean. Well, the long-term mean is about 82%, and it is currently approaching 200%. Of course, there is abundant (and rising) liquidity that needs to go somewhere, and much of it is going into risk assets like stocks, but the point is well taken.
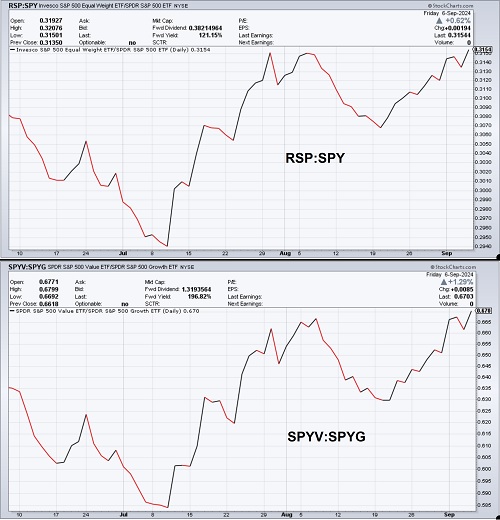
Price ratios of key indexes can illustrate changes in market breadth. As examples, the upper chart below shows the 3-month price ratio of the equal-weight S&P 500 (RSP) divided by the cap-weight S&P 500 (SPY), and the lower chart shows the 3-month ratio of S&P 500 Value (SPYV) divided by S&P 500 Growth (SPYG). Both charts are nearly identical over this timeframe. Notably, the value and quality-oriented Dow Jones Industrials (DIA) divided by Nasdaq 100 (QQQ) looks quite similar as well. All are at 3-month highs and on buy signals—above the 20-day simple moving average and pointing upwards.
After displaying extreme positive performance and valuation divergences into mid-July, the market began to rotate and broaden into the lagging segments. Long-invincible Growth has been crushed by Value (although Growth is still well ahead YTD). Moreover, Technology (XLK) has fallen dramatically while defensive/value sectors like Consumer Staples (XLP), Real Estate (XLRE), and Utilities (XLU) have held up much better over the past month. After all, for quite a while the Big Tech titans have served as a safe, “defensive” play given their wide “moats,” impenetrable brand loyalty, huge cash balances, and massive capex budgets providing a huge advantage in innovation.
When the imminence of Fed rate cuts was in doubt, capital kept flowing into the cash-flush mega-cap Tech titans, pushing up their valuation multiples. But when the economic data soured, rate cuts came back in play, and the capital-intensive and interest-rate-sensitive value and quality stocks became attractive given their much lower valuation multiples. For example, the forward P/E ratio on the Nasdaq 100 (QQQ) is 24.5x and the forward P/E-to-Growth ratio (PEG) is 1.50x, and the S&P 500 (SPY) is at 21.0x and 1.54x, as of 9/6. But looking beyond cap-weighted, broad market indexes we find more palatable valuations, with the equal-weight Nasdaq 100 (QQQE) at a forward P/E of 22.0x and forward PEG of 1.50x, and the equal-weight S&P 500 (RSP) at 16.7x and 1.58x. The lower the forward P/E and PEG, the better, so while the forward PEG ratios for the equal-weight indexes are about the same as their more popular cap-weight versions, the forward P/Es for the equal weights are much more attractive.
On the other hand, small caps surged in July but have fallen out of favor, likely due to recession fears. Some commentators opined at the time that the small-cap rally was unsustainable because it was not supported by fundamentals given that the percentage of companies in the Russell 2000 that are unprofitable (negative trailing 12-month EPS) has risen from 15% in the 1990’s to 41% today. Moreover, they have high debt loads and thus rely on new debt issuance to stay solvent (euphemistically called “zombie” companies). But when you look at the subset of fundamentally sound small caps, they comprise an undervalued asset class. For example, the quality-oriented S&P 600 SmallCap (SPSM), which requires consistent profitability for index eligibility, has a forward P/E of 14.5x and a forward PEG of 1.41x, while the zombie-laden Russell 2000 (IWM) is at 15.3x and 1.23x.
Assuming the Fed provides a combination of falling interest rates with a modest uptrend in M2 money supply (in line with organic economic growth), an active selection approach that identifies high-quality companies with the best fundamentals and growth prospects—which is what Sabrient seeks to do with our Small Cap Growth portfolio. Furthermore, our new Scorecard for Stocks (soon to launch as a research subscription) provides the Top 30 stocks on a weekly basis for each of four investing strategies, including a rules-based version of Sabrient founder David Brown’s Small Cap Investing strategy, as described in his new investing book—which will be published on Amazon.com shortly.
Summary:
So, this all suggests to me a 50-bps rate cut on 9/18 is justified. In fact, rates should be 100 bps lower now, but that would be too much of a shock to the financial system to implement all at once. But it should get done by January at the latest. The only potential caveat is GDP growth, with Q2 real GDP growth having been revised up from 2.8% to 3.0%. However, Vance Ginn, the former chief economist of the White House's Office of Management and Budget tweeted, “When you correctly subtract volatile inventory investment and redistributionary, unproductive government spending, the productive private sector growth was just 1.3%.... It's good that GDP inflation moderated to 2.3%, but disposable personal income increased by just 1%, and the savings rate declined to a fresh low of 3.5%.... Bottom line: The American economy continues to fluctuate greatly because of bad fiscal and monetary policies that contribute to poor outcomes for many Americans.” Looking ahead, the Atlanta Fed’s GDPNow estimate for Q3 is 2.5% (as of 9/9).
Moreover, two indicators of GDP are Gross Domestic Income (GDI) and economist Mark Skousen’s Gross Output (GO), and both suggest there may be downward revisions to prior GDP readings ahead. GDI typically grows in line with GDP (and is considered a more accurate metric, but the two have diverged of late, with Q2 real GDI growth at just 1.3%. And regarding GO, the BEA publishes GO as a measure of the full scope of commerce throughout the supply chain (not just final demand like GDP), but Skousen also computes an adjusted version of his GO metric that uses gross wholesale and retail figures, as opposed to the BEA’s headline version that uses only net figures. Adjusted GO grew in Q1 at a nominal annualized rate of just 1.0% (for some reason it is reported much later than the other metrics, so Q2 still isn’t out yet). In addition, the latest GO report shows B2B spending growth turned slightly negative—further evidence that only government deficit spending has kept GDP and jobs growth barely positive rather than fostering strong organic growth from a vibrant private sector that is much more adept at efficient capital allocation.
By the way, the 2-10 yield curve “un-inverted” last week, with the 2-year closing the week at 3.65% and the 10-year at 3.71%. So, the technical “inversion” is over. However, I have written in the past that suspected manipulation of the 10-year Treasury note (with issuances mostly occurring on the non-coupon short end of the yield curve) was not indicative of a true market rate. Michael Howell of CrossBorder Capital has computed an adjusted 10-year yield based on essentially risk-free agency mortgage-backed securities (MBS) which suggests the market-based yield curve never actually inverted (and has been steepening for the past 18 months). As do I, Howell thinks that the Fed feels a need to weaken the dollar, which means a surge in liquidity is coming (via tactics like drawing down the TGA and RRP facility, cutting banks’ SLR, and debt monetization) that sparks a stock market rally well into 2025.
So, again, I think the Fed needs to cut more aggressively, particularly if the August inflation metrics fall meaningfully. Indeed, the collapse in market Treasury yields following the FOMC rate decision on 7/31 indicates that investors are signaling a belief that the Fed made a policy mistake by holding off. Many commentators believe a surprise 50-bps cut is unlikely due to the shock it would cause to the global financial system (including leveraged carry trades)—which is why starting with 25 bps in July would have been the prudent move. As a reminder, heading into the July FOMC meeting, former New York Fed President Bill Dudley reversed his hawkish view and called for an immediate rate cut, “I’ve long been in the ‘higher for longer’ camp… The facts have changed, so I’ve changed my mind. The Fed should cut, preferably at next week’s policy-making meeting… Although it might already be too late to fend off a recession by cutting rates, dawdling now unnecessarily increases the risk.”
At the Kansas City Fed's annual economic symposium on 8/23 in Jackson Hole, WY, Fed Chair Powell himself admitted, "Today, the labor market has cooled considerably from its formerly overheated state… the cooling in labor market conditions is unmistakable… All told, labor market conditions are now less tight than just before the pandemic in 2019... The time has come for policy to adjust. The direction of travel is clear, and the timing and pace of rate cuts will depend on incoming data, the evolving outlook, and the balance of risks.” But I’m concerned about Powell’s insistence on being “data dependent” with inflation data that seems focused on YoY comps rather than the most current trend (e.g., annualized 3-month metrics). We shall see what the August CPI and PPI reports show on 9/11 and 9/12, respectively.
Again, my view is that “normalization” means ultimately taking fed funds down to a terminal rate of about 3.0-3.5% (from today's 5.25-5.50%), and there seems to be little reason for the FOMC to take a 25-bps baby step when it is now apparent that a July cut would have been appropriate—particularly given the growing struggles in the economy and jobs (and a growing realization that maybe “Bidenomics” has not been so fruitful after all). So, let’s get moving on rate normalization with a 50-bps cut this month. Fed funds futures today put the odds at about 27%.
Final Thoughts:
We as a nation need to bring back calm, sober discourse to offset all the noise and distortion surrounding the presidential election, especially given its potential impact on fiscal policy, the budget deficit, economic growth, and inflation. So, here are some rational musings for you to ponder (and perhaps share).
I can’t help but be dismayed that neither Vice-President Harris nor Governor Walz has worked a day in their adult lives in the private sector, so perhaps it’s no surprise that their first instinct to solving inflation is to accuse private enterprise of price-gouging. They have always been on the taxpayer payroll. They believe in Big Government, even though government spending programs have proven to be bad at generating ROI. In fact, most of the federal budget today goes toward entitlement programs and interest on our massive debt. Their party convention was focused on little more than emotional proclamations of “hope and joy,” identity politics, celebrity speeches, and “anyone but Trump,” with no real substance or policy discussion—except to distance Harris from her long-held views expressed during her previous presidential run (and in her current White House stint as VP). Their platform seems to be heavy on entitlements, deficit spending, taxation, regulation, DEI, and limitations on the Bill of Rights—none of which are popular, which is why they avoid talking about any of it.
But I think what distresses me most about the Democrat ticket is that their desire for the White House seems devoid of passion or true leadership. Harris was installed as a figurehead, a cog in the party machine, rewarded for her loyalty with the party nomination without having to endure a primary campaign or a single debate or press conference. Surely, dutifully obeying her handlers and avoiding honest discussion with the press and instead simply reading teleprompter lines and toeing the party line does not reflect much passion in her mission, or value in her unique ability to lead the greatest and most powerful country on earth, or to fix real problems and repair societal discord and degradation.
Ultimately, Harris seems to be just a fresh coat of paint on the same ramshackle house, i.e., a new face on the same misguided policies. No worries, she promises to double-down on those policies—we just need to print more money to throw at them. Her biggest policy proposal is to punish greedy businesses for price gouging and then raise taxes on them so that they have less to invest in growth, capex, or hiring—all as a way to somehow support the middle class. But while the middle class was gaining ground during the Trump years (with his business- and worker-friendly policies), it has struggled mightily under Democrat leadership and especially over the last 4 years.
As for former President Trump, he came onto the scene in 2015 as a “rogue elephant” from the private sector, bent on upending the Washington “swamp.” Love him or hate him, you can’t deny that Trump is a strong, passionate leader. He has remade the Republican Party in his image with his populist and constitutionalist vision. As a billionaire, it is clear he is not in it to enrich himself (like most career politicians) nor as a vanity pursuit (since he is already rich and famous and does not need the headaches and threats to his life that public office brings). Instead, he seems to sincerely want to “fix” the country and believes only he can—as only a highly successful extrovert from the private sector can do with sincerity (much like Arnold Schwarzenegger when he became “governator” of California). As such, he is unbribable.
Although Trump doesn’t have the vacuous celebrity class behind him, he has something better—brilliant individuals like Vivek Ramaswamy, Elon Musk, David Sacks, Bill Ackman, Marc Andreessen, and RJK Jr., and their reasoned, rational perspectives. Like most of them, I was a reluctant Trump supporter at first. In 2016, I voted in the primary for John Kasich, thinking he had the best qualifications. But I began to appreciate the method to Trump’s madness as president, although I grew weary of his combativeness with the hostile press. He is flawed in many ways (aren’t we all?), and he doesn’t take unfair criticism well. Indeed, the press and Dems revel in pushing his buttons; they were (and remain) relentless. In 2020, given the pervasive and disorienting mind-virus of Trump Derangement Syndrome (TDS), unfounded impeachment proceedings, and the summer violence and vitriol, I briefly considered voting for Biden, thinking he could be a unifier—but then I came to my senses five minutes later. Of course, Biden turned out to be an angry divider, accusing half the population (“the MAGA bunch”) of being potential domestic terrorists and weaponizing the justice system.
Most of all, Trump is extremely passionate about—and loves to extemporaneously expound upon (anytime to any audience, no matter what his handlers tell him)—how he intends to “save the country” by restoring the American ideals of freedom, independence, liberty, equal opportunity, personal responsibility, meritocracy, initiative, entrepreneurship, capitalism. But the Left insists these are racist, homophobic, misogynist, White Christian constructs of oppression. Real freedom, we are told, is legalized drug use; “reimagined” (aka defunded) policing, no-cash bail, and decriminalization; gender fluidity; unrestricted abortion; single motherhood and deemphasis of the family unit; equal outcomes, DEI, and affirmative action; and a benevolent government “nanny state” that decides for you what speech is permissible and how best to allocate scarce capital for the common good. Today’s push for “equity” has cultivated an entitlement mentality that insists upon a lowering of standards, expectations, and outcomes to the lowest common denominator, which serves no one in the long run. Ignorance is not bliss, but progressive ideology thrives in ignorance.
Rather than lowering standards and expectations and encouraging more dependency, society and government leaders should seek to elevate higher standards and expectations and less dependency—which means a return to the standards that made us great in the first place. I know it can be a scary thought for those who have been conditioned to rely on government handouts, but reducing federal spending and cutting taxes to shift capital from relatively unproductive government spending into the hands of relatively productive private enterprise would be a long-term win for our economy and all the industrious workers who crave greater personal growth and prosperity.
After all, today’s domestic problems (e.g., massive debt, wealth inequality, illegal immigration, homelessness, sluggish economy, societal discord) largely stem from the accumulation of post-GFC fiscal and monetary policies of the past 16 years, of which 12 years were led by Democrat presidents (with VP Harris’ deciding vote on some big deficit spending bills, as President of the Senate). And those four short years under Trump were pretty darn peaceful for the world and prosperous for most Americans of all demographics across the board (at least before the pandemic disruption), with his tax cuts, deregulation, border security, and international diplomacy (rather than weaponry—to avoid rather than stoke conflict). And yet so many otherwise clear-thinking people feel compelled to vote for policies that are not in their best interest. Policies matter.
You get more of what you tolerate and incentivize. Just like if you impose no rules or guardrails for your kids or dogs, you get filth and disorder in the home. Same for society. No rules? Anything goes. And the Law of Entropy says that without the rule of law, secure borders, or moral constraints, order disintegrates and chaos ensues. Similarly, as voters, we get what we incentivize—and we certainly don’t elect politicians who talk about cutting spending programs. We are gradually becoming a socialist welfare state, creeping ever closer to Europeanization and Californication, not to mention Japanification (astronomical debt/GDP ratio, sluggish growth, aging demographics).
Fortunately, it seems to be reaching a point in which rational thinking people of all races are starting to push back on the Left’s divisive, costly, counterproductive, win/lose policies. It seems the “silent majority” is once again demanding uncensored speech (“sunlight is the best antiseptic”) and the unified moral compass that historically has served as societal guardrails to foster social cohesion. As the WSJ recently opined, “Trust in government is declining in democracies around the world, and leaders don’t help themselves or their countries when they blur lines between criminal conduct and speech they find offensive.”
The siren song of entitlements always sounds so pleasing, but overpromising and overreaching always seems to find a way back to haunt us. To be sure, scaling back on entitlements is no easy task—and it requires a united effort behind a strong leader—not toadies and opportunists who only spout the party line or tell the masses what they want to hear. But it usually doesn’t happen until a nation reaches of point of desperation—like what happened in Argentina.
Sabrient Scorecards for Stocks and ETFs
We at Sabrient believe that a high-quality, fundamentally strong stock is one that displays consistent, reliable, and accelerating sales and earnings growth; positive revisions to analysts’ consensus estimates; rising profit margins and free cash flow; and solid earnings quality. In addition, it should have a leading position in its industry and product category; a strong balance sheet with low debt levels; and high return ratios, e.g., return on equity (ROE) and return on capital employed (ROCE). Also, a history of dividend growth and/or share buybacks is desirable.
Sabrient founder David Brown is the author of a number of books, including a brand-new book that will soon be available on Amazon.com entitled, How to Build High Performance Stock Portfolios. We also will offer a subscription to a downloadable multi-tab spreadsheet called Sabrient Scorecard for Stocks, updated weekly with our Top 30 highest-ranked stock picks for each of four specific investing styles: Growth, Value, Dividend Income, and Small Cap investing. And as a bonus, we will provide a weekly Scorecard for ETFs that scores and ranks over 1,300 US-listed equity ETFs, in accordance with our SectorCast model described below.
Both sheets will be posted weekly in Excel format and allow you to see how your stocks and ETFs rank in our system…or for identifying the top-ranked stocks and ETFs (or for weighted combinations of our alpha factors). I will be sending out a formal announcement on the launch of David’s book and the new Scorecards shortly, so be sure you are on our mailing list!
Latest Sector Rankings
Relative sector rankings are based on our proprietary SectorCast model, which builds a composite profile of each of over 1,400 equity ETFs based on bottom-up aggregate scoring of the constituent stocks. The Outlook Score is a Growth at a Reasonable Price (GARP) model that employs a forward-looking, fundamentals-based multifactor algorithm considering forward valuation, historical and projected earnings growth, the dynamics of Wall Street analysts’ consensus earnings estimates and recent revisions (up or down), quality and sustainability of reported earnings, and various return ratios. It helps us predict relative performance over the next 3-6 months.
In addition, SectorCast computes a Bull Score and Bear Score for each ETF based on recent price behavior of the constituent stocks on particularly strong and weak market days. A high Bull score indicates that stocks within the ETF recently have tended toward relative outperformance when the market is strong, while a high Bear score indicates that stocks within the ETF have tended to hold up relatively well (i.e., safe havens) when the market is weak. Outlook score is forward-looking while Bull and Bear are backward-looking.
As a group, these three scores can be helpful for positioning a portfolio for a given set of anticipated market conditions. Of course, each ETF holds a unique portfolio of stocks and position weights, so the sectors represented will score differently depending upon which set of ETFs is used. We use the iShares that represent the ten major U.S. business sectors: Financials (IYF), Technology (IYW), Industrials (IYJ), Healthcare (IYH), Consumer Staples (IYK), Consumer Discretionary (IYC), Energy (IYE), Basic Materials (IYM), Telecommunications (IYZ), and Utilities (IDU). Whereas the Select Sector SPDRs only contain stocks from the S&P 500 large cap index, I prefer the iShares for their larger universe and broader diversity.

The table above shows the latest fundamentals-based Outlook rankings and my full sector rotation table. I would call the rankings neutral given that all-weather, secular-growth Technology stands alone at the top with a robust Outlook score of 90 but cyclicals and defensives are mixed throughout. Bullish rankings would entail cyclical and economically sensitive sectors dominating the top half of the rankings with scores well above 50 and defensive sectors in the lower half.
Although much lower after the market correction, Technology still displays by far the highest forward P/E at 26.3x. But the sector scores at or near the top in every other factor, with strong forward EPS growth estimates (18.4%), a reasonable forward PEG (ratio of forward P/E to EPS growth) of 1.43, consistently positive earnings revisions from the Wall Street analyst community, by far the best return ratios, and by far the best insider sentiment (open market buying). Rounding out the top 6 are Healthcare, Telecom, Financials, Healthcare, Consumer Staples, and Industrials. Notably, several other sectors are again seeing positive revisions to EPS estimates, including Telecom, Financials, Healthcare, and Utilities.
Notably, Energy and Telecom display the lowest forward P/Es at 11.9x and 12.8x, respectively, with Financials close behind at 13.8x. Financials has by far the lowest forward PEG of 1.12 (with an EPS growth estimate of 12.4%). At the bottom of the rankings are Energy, Utilities and Materials, mainly due to low projected EPS growth rates, poor return ratios, and high PEG ratios.
Keep in mind, the Outlook Rank does not include timing, momentum, or relative strength factors, but rather reflects the consensus fundamental expectations at a given point in time for individual stocks, aggregated by sector.
ETF Trading Ideas
Our rules-based Sector Rotation model, which appropriately weights Outlook, Bull, and Bear scores in accordance with the overall market’s prevailing trend (bullish, neutral, or defensive), moved to a neutral bias again last week with the big red candle pattern taking SPY firmly below its 50-day moving average (after a couple of weeks bullish following the quick recovery from the early-August selloff). (Note: In this model, we consider the bias to be bullish from a rules-based trend-following standpoint when SPY is above both its 50-day and 200-day simple moving averages, but neutral if it is between those SMAs while searching for direction, and defensive if below both SMAs.)
Thus, it now suggests holding Technology (IYW), Telecom (IYZ), and Financials (IYF), in that order. However, if you prefer a bullish stance (given the oversold conditions), the Sector Rotation model suggests holding Technology, Telecom, and Industrials (IYJ), in that order. Or, if you prefer to take a defensive stance on the market (given the potential for more downside), it suggests holding Consumer Staples (IYK), Utilities (IDU), and Healthcare (IYH), in that order.
An assortment of other interesting ETFs that are scoring well in our latest rankings include: iShares MSCI Global Gold Minders (RING), Pacer US Large Cap Cash Cows Growth Leaders (COWG), Amplify Emerging Markets FinTech (EMFQ), Innovator IBD 50 (FFTY), ERShares Private-Public Crossover (XOVR), AXS Esoterica NextG Economy (WUGI), Invesco S&P MidCap Momentum (XMMO), Fidelity Disruptive Communications (FDCF), American Century Focused Dynamic Growth (FDG), Goldman Sachs Future Consumer Equity (GBUY), SEI Enhanced US Large Cap Momentum (SEIM), ETC 6 Meridian Small Cap Equity (SIXS), Invesco Next Gen Media and Gaming (GGME), First Trust Innovation Leaders (ILDR), AB Disruptors (FWD), Roundhill Generative AI & Technology (CHAT), Invesco Building & Construction (PKB), Franklin Intelligent Machines (IQM), Inspire Fidelis Multi Factor (FDLS), and BNY Mellon Women’s Opportunities (BKWO). All score in the top decile (90-100) of Outlook scores.
As always, I welcome your thoughts on this article! Please email me anytime. Any and all feedback is appreciated! In particular, please tell me what sections you find the most valuable—commentary, SectorCast scores, or ETF trading ideas / sector rotation model. Also, please let me know of your interest in:
1. One of Sabrient’s new indexes for ETF investing, such as High-Quality Growth (similar to our Baker’s Dozen model), Quality Growth & Income, SMID-Cap Quality Plus Momentum, High-Quality Technology, High-Quality Energy, Quality Legacy & Green Energy, or Defensive Equity.
2. Sabrient’s Scorecards with our rankings of stocks and ETFs and the Top 30 stocks for each of David Brown’s 4 key investing strategies: Growth, Value, Dividend, Small Cap.
More By This Author:
Summer Selloff Arrives, But Is It The Start Of A Bear Market Or A Buying Opportunity?
Inflation And The Economy Slow, Real Rates Rise, And The Fed Is Behind The Curve
Tech Looks Bulletproof Despite High Valuations And Narrow Market Leadership


Comments
Log in or sign up to join the conversation.