

Image Source: Pixabay
Last week, the much-anticipated inflation readings for May—and the associated reaction from the Fed on planned rate cuts—was pretty much a non-event. The good news is core inflation continues to gradually fall. The bad news is it isn’t falling fast enough for the Fed. Headline CPI and PPI are pretty much stagnant over the past 12 months. This led the Fed to be mealy-mouthed about rate cuts. One might ask, why does it matter so much what the Fed does when the economy is doing fine, we have avoided recession, wages are growing, jobs are plentiful, unemployment is low, and asset prices are rising?
But the reality is there is a slow underlying deterioration happening from the lag effects of monetary tightening that is becoming increasingly apparent, including a lack of organic jobs and GDP growth (which is instead largely driven by government deficit spending) and a housing market (important for creating a “wealth effect” in our society) that is weakening (with growing inventory and slowing sales) given high mortgage rates that make for reluctant sellers and stretched buyers (notably, the 10-year yield and mortgage rates have pulled back of late just from rate cut talk). Moreover, real-time shelter inflation (e.g., rent) has been flat despite what the long-lagged CPI metrics indicate, and the real-time, blockchain-based Truflation reading has been hovering around 2.2% YoY, which happens to match the April and May PPI readings—all of which are very close to the Fed’s 2.0% inflation target.
Of course, stock market valuations are reliant upon expectations about economic growth, corporate earnings, and interest rates; and interest rates in turn are dependent on inflation readings. Although some observers saw promising trends in some components of May CPI and PPI, Fed chair Jay Powell played it down with the term “modest further progress,” and the “dot plot” on future rate cuts suggests only one or perhaps two rate cuts later this year.
Nevertheless, I continue to believe the Fed actually wants to cut rates sooner than later and likely will do so during Q3—especially now that central banks in the EU, Canada, Sweden, Switzerland, Brazil, Chile, and Mexico have all cut rates. Moreover, Japan is struggling to support the yen with a positive interest rate—but it needs to keep rates low to prevent hurting its highly leveraged economy, so it needs the US to cut rates instead. The popular yen “carry trade” (short the yen, buy the dollar and US Treasuries) has been particularly difficult for the BoJ. All told, without commensurate cuts here in the US, it makes the dollar even stronger and thus harder on our trading partners to support their currencies and on emerging markets that tend to carry dollar-denominated debt. I talk more about this and other difficulties outside of the (often misleading) headline economic numbers in today’s post—including the “tapped out” consumer and the impact of unfettered (wartime-esque) federal spending on GDP, jobs, and inflation.
As for stocks, so far, the market’s “Roaring 20’s” next-century redux has proven quite resilient despite harsh obstacles like global pandemic, multiple wars, a surge in inflation, extreme political polarization, and societal discord, unpredictable Fed policy, rising crime and mass immigration, not to mention doors flying off commercial aircraft (and now counterfeit titanium from China!). But investors have sought safety in a different way from the past, particularly given that stubborn inflation has hurt real returns. Rather than traditional defensive plays like non-cyclicals, international diversification, and fixed income, investors instead have turned to cash-flush, secular-growth, Big Tech. Supporting the bullishness is the CBOE Volatility Index (VIX), which is back down around the 12 handle and is approaching levels not seen since 2017 during the “Trump Bump.” And given their steady performance coupled with the low market volatility, it has also encouraged risk-taking in speculative companies that may ride coattails of the Big Tech titans.
But most of all, of course, driving the rally (other than massive government deficit spending) has been the promise, rapid development, and implementation of Gen AI—as well as the new trends of “on-premises AI” for the workplace that avoids disruptions due to connectivity, latency, and cybersecurity, and AI personal computers that can perform the complex tasks of an analyst or assistant. The Technology sector has gone nearly vertical with AI giddiness, and it continues to stand alone atop Sabrient’s SectorCast rankings. And AI poster child NVIDIA (NVDA), despite being up 166% YTD, continues to score well in our Growth at Reasonable Price (GARP) model (95/100), and reasonably well in our Value model (79/100).
Nevertheless, I continue to believe there is more of a market correction in store this summer—even if for no other reason than mean reversion and the adage that nothing goes up in a straight line. Certainly, the technicals have become extremely overbought, especially on the monthly charts—which show a lot of potential downside if momentum gets a head of steam and the algo traders turn bearish. On the other hand, the giddy anticipation of rate cuts along with the massive stores of cash in money market funds as potential fuel may well keep a solid bid under stocks. Either way, longer term I expect higher prices by year-end and into 2025 as high valuations are largely justified by incredible corporate earnings growth, a high ratio of corporate profits to GDP, and the promise of continued profit growth due to tremendous improvements in productivity, efficiency, and the pace of product development across the entire economy from Gen AI. In addition, central banks around the world are starting to cut rates and inject liquidity, which some expect to add as much as $2 trillion into the global economy—and into stocks and bonds.
On another note, it is striking that roughly half the world’s population goes to the polls to vote on their political leadership this year, and increasingly, people around the world have been seeking a different direction, expressing dissatisfaction with the status quo of their countries including issues like crime, mass immigration (often with a lack of assimilation), sticky inflation, stagnant economic growth, and a growing wealth gap—all of which have worsened in the aftermath of the pandemic lockdowns and acquiescence to social justice demands of the Far Left. Ever since the Brexit and Trump victories in 2016, there has been a growing undercurrent of populism, nationalism, capitalism, and frustration with perceived corruption, dishonesty, and focus on global over local priorities. Not so long ago, we saw a complete change in direction in El Salvador (Bukele) and Argentina (Milei) with impressive results (e.g., reducing rampant crime and runaway inflation), at least so far. Most recently, there were surprises in elections in India, Mexico, and across Europe. Although we are seeing plenty of turmoil of our own in the US, global upheaval and uncertainty always diverts capital to the relative safety of the US, including US stocks, bonds, and the dollar.
I expect US large caps to remain an attractive destination for global investment capital. But while Tech gets all the (well deserved) attention for its disruptive innovation and exponential earnings growth, there are many companies that can capitalize on the productivity-enhancing innovation to drive their own growth or those that are just well positioned as “boring” but high-quality, cash-generating machines that enjoy strong institutional buying, strong technicals, and strong fundamentals in stable, growing business segments—like insurers and reinsurers for example.
So, I believe both US stocks and bonds will do well this year (and next) but should be hedged with gold, crypto, and TIPS against a loss in purchasing power (for all currencies, not just the dollar). Furthermore, I believe all investors should maintain exposure to the Big Tech titans with their huge cash stores and wide moats, as well as perhaps a few of the speculative names (as “lottery tickets”) having the potential to profit wildly as suppliers or “coat-tailers” to the titans, much of their equity exposure should be in fundamentally solid names with a history of and continued expectations for consistent and reliable sales and earnings growth, rising profit margins and cash flow, sound earnings quality, and low debt.
Indeed, Sabrient has long employed such factors in our GARP model for selecting our growth-oriented Baker’s Dozen portfolio, along with other factors for other portfolios like our Forward Looking Value portfolio, which relies upon our Strategic Valuation Rank (SVR), our Dividend portfolio, which is a growth & income strategy that relies on our proprietary Dividend Rank (DIV), and our Small Cap Growth portfolio, an alpha-seeking alternative to the Russell 2000. Notably, our Earnings Quality Rank (EQR) is not only a key factor we use internally for each of these portfolios, but it is also licensed to the actively managed First Trust Long-Short ETF (FTLS) as an initial screen.
Each of these alpha factors and how they are used within Sabrient’s Growth, Value, Dividend income, and Small Cap investing strategies is discussed in detail in David Brown’s new book, How to Build High Performance Stock Portfolios, which will be published imminently. (I will send out a notification soon!)
In today’s post, I talk more about inflation, the Fed, and the extreme divergences in relative performance and valuations. I also discuss Sabrient’s latest fundamentals-based SectorCast quantitative rankings of the ten U.S. business sectors (which, no surprise, continue to be led by Technology), current positioning of our sector rotation model, and several top-ranked ETF ideas. And don’t skip my Final Comments section, in which I have something to say about BRICS’ desire to create a parallel financial system outside of US dollar dominance, and the destructiveness of our politically polarized society and out-of-control deficit spending.
Market commentary:
For many traders, persistently low volatility can be a sign of extreme complacency and a set up for a sudden market selloff. But in fact, it is also consistent with past bull market readings. Typically, the VIX starts ascending well ahead of a market top. Also supportive of the rally are US corporate bond spreads, which remain tight, reflecting investor confidence in the avoidance of recession and bond defaults. Recall that spreads increased ahead of the peaks in stocks in 2000 and 2007, before those recessions and bear markets. Robust share buyback programs are also keeping a bid under equities and dampening volatility. In addition, it appears fewer traders are buying near-the-money puts and instead are mostly sticking with well-out-of-the-money “Black Swan” put hedges.
Although the expected improvements from Gen AI in enhancing productivity, efficiency, and faster product development extend throughout the economy, it is the Technology sector that has been leading the charge and getting all the investor attention—and primarily the MAG-7 (or more precisely, the MAG-6, as Tesla (TSLA)—down -28%—has not proven itself worthy of membership in the club this year). Although the promise of AI will benefit all sectors, without the MAG-7, S&P 500 earnings growth is much less impressive—but that is widely expected to change as AI adoption accelerates.
Many traders thought the Apple (AAPL) developers conference last week would provide a new AI catalyst to energize stocks during the summer doldrums. We didn’t see a broad surge, but at least Apple (AAPL) got a nice little spike to new all-time highs. In fact, there are now three companies with market caps over $3 trillion for the first time ever: Apple, Microsoft (MSFT), and wunderkind NVIDIA, which are now essentially neck-and-neck in market cap. Those three now make up nearly 20% of the S&P 500 (SPY) and nearly 25% of the Nasdaq 100 (QQQ). But as long as those names don’t sell off, and their dominance and amazing earnings growth suggests they won’t (after all, we’re not talking about Internet bubble-era valuations based on eyeballs and revenue growth rather than earnings), capital should flow into other names as the market continues higher.
By the way, just as Big Tech titans continue use their massive cash stores and cash flows to seed AI startups and other disruptive technologies, several $1 billion deals in AI and late-stage unicorn startups have boosted an otherwise sleepy VC market (and those Gen AI startups are reaching profitability faster than their other portfolio companies). This reflects the dominance of the Big Tech titans in both private and public markets, which not surprisingly has drawn the scrutiny of regulators for anti-trust reasons.
Inflation proving sticky, the delay in anticipated rate cuts, and belief that “higher for longer” interest rates are a fait accompli has led to a rotation back into cash-flush, secular-growth, Big Tech and out of interest-rate-sensitive cyclicals and small caps. But counterintuitively, Utilities were tagging along with Tech (until its recent June pullback) on the expectation of surging power requirements due to exponential growth in Gen AI applications. Meanwhile, deferred rate cuts have stalled gold’s bull run—albeit likely only temporarily. So far in 2024, most of the charts look a lot like the first half of 2023.
But for now, even as the S&P 500 has been hitting new highs, it has not been confirmed by breadth or volume metrics, and the lack of breadth is worrisome for sustainability of the rally. Many internal measures of breadth are forming negative divergences even as the broad market index continues higher—including bullish percent data and the percentage of stocks above their 50-day moving averages. Among NYSE-listed stocks, there are more 52-week lows than highs and more decliners than advancers. All of this is worrisome, for sure. But although I think we are due for a larger correction, the resolution ultimately will be a broadening into other names rather than a major selloff, particularly given the nascent rise in global liquidity and a rate-cutting cycle among central banks around the world.
So, my view is that the relative safety, wide moats, and reliability and consistency of earnings growth of large caps in general and large-cap Tech, in particular, means these names should continue to have a prominent place within a diversified equity portfolio—but these extreme performance and valuation divergences suggests an investor also should make room for a broader set of high-quality equities across market caps and sectors in anticipation of improving market breadth.
Bad breadth (pun intended) and valuations:
Correlations between US large and small cap stocks remain the lowest in many years. It started in earnest in 2017 and has worsened ever since. According to Bespoke Investment Group, within the S&P 500, the average stock is currently trading 12.3% below its 52-week high, which is they say is “fairly normal,” but within the small-cap Russell 2000, the average stock is trading 28.3% below its 52-week high. Moreover, a study by Bespoke showed that only the top decile by market cap in the S&P 500 (i.e., the largest 50 stocks) has outperformed the broad index this year.
Narrow leadership from Big Tech has been in play periodically since around 2015 (when the FAANG acronym was coined), but it has really revealed itself during the current bull run began in October 2022. The following charts illustrate the magnitude of the divergences between the cap-weighted (and Big Tech-dominated) S&P 500 (SPY), the equal-weight S&P 500 (RSP), small-cap Russell 2000 (IWM), and the iShares 20+ Year Treasury Bond (TLT). You can see that from the Great Financial Crisis until the pandemic lockdowns, the stock and bond indexes all generally moved higher and then converged (as bonds surged while stocks collapsed) upon the onset of the pandemic. But ever since then, TLT has been falling (and interest rates rose). Meanwhile, SPY, RSP, and IWM all surged through 2020, but then large caps (both SPY and RSP) kept rising while small caps flattened out in 2021. Then, they all faltered in 2022. But SPY has surged once again to achieve several all-time highs while RSP and IWM have struggled for traction. While RSP did recently achieve an all-time high, it has not kept pace with SPY, and IWM is still 17% below its 2021 all-time high. YTD through 6/14, QQQ is up +17.2% and SPY +14.5%, while RSP is +4.2%, IWM -0.5%. Even more distressingly, the quality-biases SPDR S&P 600 SmallCap (SPSM) is down -2.7%.
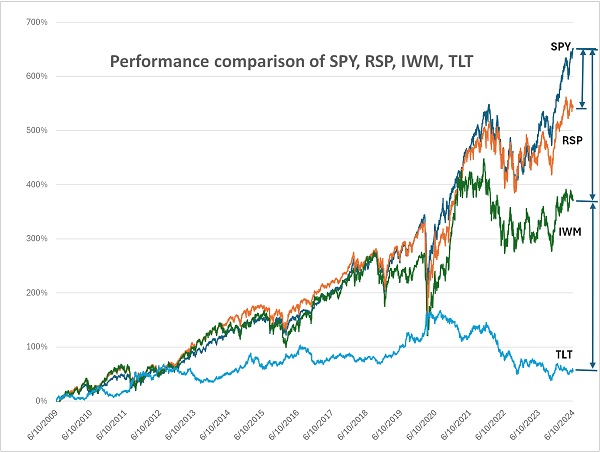
TLT is also down -2.7%. Bonds are in the throes of their longest bear market in history (46 months) during which T-Bonds have lost about half their value. That should end once the Fed policy shifts.
The next chart drills down on the ratios of RSP:SPY and IWM:SPY to further illustrate the historic divergences. Forward valuations provide further insight, as QQQ has a forward P/E of 26.9x and SPY is 21.0x, while equal-weight RSP is at 16.2x, IWM is 15.0x, and SPSM is just 13.8x. It shouldn’t come as a surprise that according to GuruFocus, the “Buffett Indicator” of total market capitalization of US stocks to US GDP ratio is almost double (191%) US GDP. Its Internet bubble high was 143% in 2000, and its all-time high was 200% in 2021 (before pulling back during the 2022 bear market).

Of course, the large cap indexes have more exposure to the high-flying, investor-favorite Technology sector. Moreover, within large cap, the cap-weighted SPY has about 30% allocation to Technology while the equal-weight RSP is about 13% Tech. The highest weight in RSP goes to Industrials at 15.7%, while SPY has only 8.5% Industrials. Compare this to SPDR S&P 400 Mid Cap (MDY) with the largest sector 22% Industrials and just 10% Tech, and small-cap SPSM with largest sector 17.8% Financials and just 13% Tech and Russell 2000 with largest sector 17% Tech followed by 16% Industrials. Notably, with NVDA up 166% YTD and hitting yet another new high seemingly every day, it alone has contributed more to YTD gains in SPY than RSP has returned this year. As a result, the Semiconductor industry now makes up about 11% of the S&P 500 market cap, which is the highest allocation in at least 20 years.
And of course, most of Technology falls in the Growth category, which is why the Growth/Value divergence is also at extremes along with Large/Small caps, with SPDR S&P 500 Growth (SPYG) up +23.1% YTD while SPDR S&P 500 Value (SPYV) is up just +4.8% and SPDR S&P 600 Small Cap Value (SLYV) is down -6.8%.
If stocks across the spectrum are enjoying solid earnings, cash flow, and margin growth, why has SPY so outperformed RSP while also displaying a much higher forward multiple? I believe it has to do with what is driving earnings, cash flow, and margins—i.e., is it driven by strong sales growth and pricing power from rabid product demand that seems limitless (NVIDIA is the poster child for this), or is it driven more by cost-cutting, improving productivity, and share buybacks, all of which have limits? Some companies are capitalizing on all of the above.
Interestingly, an increasing number of cash-rich Tech companies are paying dividends now as a sign of capital discipline, particularly given their already massive spending on R&D. Even with generally lower dividend yields, given its 30% sector weighting in the S&P 500, Technology accounted for 14% of cash dividends paid by S&P 500 companies in 2023, which was second only to Financials (despite its much-lower 13% sector weighting). This means dividend-oriented strategies can increasingly include Tech companies—which is promising for growth & income strategies like the Sabrient Dividend portfolio, which has had to look mostly outside of Tech in search of yield.
On the other side of the coin, we have the divergence between cash-rich companies (many of whom stocked up on long-term debt when rates were ultra-low, leading to a high interest coverage ratio today) versus those who relied upon short-term debt that soon must be rolled over into today’s higher interest rates. This is particularly true in the high-yield/speculative-grade market where there is a “debt maturity wall” that really starts to surge in 2026 and could become a substantial risk to the market if rates don’t drop significantly.
Nevertheless, mean reversion is a historical reality, and even the most desirable companies may eventually see investors balk at their valuations at some point—such as when their sky-high growth rates show signs of slowing and/or when their forward PEG ratios (forward P/E divided by projected EPS growth rate over the next 12 months) get too high (e.g., as they approach 2.0). Once this year’s narrow, AI-driven market surge, led by a handful of Big Tech companies, has run its course, and assuming there is no recession or Black Swan event, I would expect a broadening into fundamentally sound, well-positioned companies rather than major market selloff. This bodes well for Sabrient’s actively selected portfolios, which are based on proven quant models that combine Growth, Value, and Quality factors.
Debt and inflation:
The Congressional Budget Office (CBO) reported the federal deficit for the month of May was $348 billion, which is $108 billion more than May 2023, and $1.7 trillion for the past 12 months, which brings the national public debt to $34.7 trillion. Furthermore, the CBO is forecasting deficits between 5.2% and 6.3% of GDP over the next 10 years, lamenting that federal spending as a percentage of GDP today is on par with major historical crises and Black Swan events like World War II, the Great Financial Crisis, and the 2020 pandemic. Debt as a percentage of GDP is around 120%, which is also a WWII level.
As shown in the chart below, interest payments have reached $1.06 trillion (and rising fast), which makes it the second largest budget expense category after social security (which is around $1.44 trillion) but are on track to become the largest spending category. And yet our leaders keep passing more spending bills and declaring more executive orders to create and spend more imaginary money.

I talked last month about the untenable level of total US debt including federal, state, and local governments, businesses, and households as well as all the other unfunded liabilities our federal government has committed to dole out (e.g., Social Security, Medicare, employee pensions, and veterans’ benefits, municipal pension liabilities, state budget shortfalls that might eventually need bailouts, and the ultimate rehab that might entail higher taxes, spending cuts, and higher inflation (to “inflate away” the debt). How could we ever possibly fix it? Who knows, but perhaps eventually the whole world will agree to wave the white flag, and the G20 will convene to arrive at a plan for global synchronized debt forgiveness…and perhaps a return to the gold standard. Is that too farfetched?
Although price inflation is gradually retreating as the consumer becomes “tapped out,” it has been federal government stimulus (funded by massive deficit spending) on boondoggles like the American Rescue Plan of 2021, the (misleading named) Inflation Reduction Act of 2022, and the CHIPS and Science ACT of 2022 (largely going to our Semiconductor industry), as well as for funding wars and war prep in Ukraine, Gaza, and Taiwan (largely going to our Defense industry), vaccine development (largely going to our Pharma industry), college debt forgiveness, and healthcare and financial support for the throngs of undocumented immigrants. All this spending has counteracted the Fed’s monetary tightening and slowed the disinflationary trend. As a result, prices in general (as measured by cumulative CPI) are about 21% higher since the pandemic lockdowns began in March 2020 (“Two weeks to flatten the curve!”).
The chart below compares PPI, CPI, Core CPI, and Core PCE. Only PCE is yet to be announced for May. PPI has risen a bit over recent months, which is likely the reason CPI has flatlined while Core CPI and Core PCE have managed to continue their gradual descent. The real-time, blockchain-based “Truflation” metric, which is published daily and historically presages CPI by several months, has been fluctuating around 2.2% lately. It's been under 3% all year and under 2.5% most of this year. Given that the long-term averages for CPI and PPI are both around 2.6%, it seems reasonable to expect disinflationary trends will push both metrics to converge below 3% over the coming months.

As I discussed in my post last month, the shelter component of CPI continues to distort the real-time situation. It still shows 5.4% year-over-year growth despite real-time rents being basically flat. Auto insurance is another that got a big 22% reset this year (I was shocked when I saw my renewal pricing). Meanwhile, an unofficial subset category of prices known as “Supercore”—which excludes food, energy, other goods, and housing rents to focus on core services other than housing—is at its lowest reading since September 2021, as lag effects of tight policy gradually manifest.
In fact, the only components of CPI that are truly surging are not particularly impacted by interest rates, such as transportation services which is 6.5% of CPI, and up 11.2% YoY mainly due to car insurance premiums that were reset this year 22% higher than last year (I was shocked when I saw my new premium); food away from home which is 5.3% of CPI and up 4.1% YoY, and electricity which is 2.5% of CPI and up 5.1% YoY mainly due to AI data centers, bitcoin mining, and a rising proportion of renewable energy sources to power the grid (which, as I discussed in my May post, don’t fully replace fossil fuels but instead add to the cost of the power grid because of their relative unreliability).
Jobs and the tapped-out consumer:
The University of Michigan’s Consumer Sentiment Index collapsed in June. No surprise when you consider that pandemic excess savings has been depleted, personal consumption and consumer spending metrics are shrinking, and labor market supply/demand dynamics have fallen back to pre-pandemic levels, as job openings have shrunk, and weekly jobless claims have risen. Despite a beat in the May non-farm payrolls report, the unemployment rate rose in May to 4.0%—which is the highest since January 2022 and is right at the Fed’s threshold of concern). It rose because civilian employment (which includes small-business start-ups) fell by 408,000 in May while the labor force (people who are either working or looking for work) fell by 250,000 such that the labor force participation rate (the share of adults in the labor force) fell.
Part-time jobs growth has greatly outpaced full-time jobs growth. Most of the new jobs are either in lower-wage segments like leisure & hospitality or healthcare, or in government (or government-funded private sector jobs). In fact, while the private sector has been cutting white-collar jobs, new white-collar jobs have been in government or in private-sector jobs created by federal (deficit) spending bills.
Furthermore, the number of people with multiple jobs now numbers 8.4 million, which is near a record high. Native-born workers are still around 2 million jobs below their pre-pandemic highs, while foreign-born workers have seen tremendous jobs growth—in fact, all the net job growth has accrued to immigrants. Looking strictly at white-collar jobs in the month of May, 414,000 immigrants (both legal and illegal) got hired, while 663,000 native-born Americans got fired, which brings the total back to 2018 levels. A recent article in Axios observed that the white-collar jobs market has stagnated with fewer openings, marathon hiring processes comprising multiple stages, complicated tests, and stubborn negotiations.
Wage growth is slowing, and credit card defaults and delinquencies keep rising. The speculative, free-spending, YOLO economy is becoming more frugal. Although personal spending and disposable income keeps rising, personal savings rate has flatlined for several months at 3.6%, which is the lowest since 2022. Overall, according to jobs site Indeed, today’s jobs market is precisely what the Fed was shooting for when it started hiking rates in 2022.
As consumers have become tapped out and their spending is shrinking, they are prioritizing value—and they love Costco (COST). Who doesn’t, right? Costco beat estimates yet again on its 5/30 release. Its 10-year price chart looks nearly monotonic outside of a difficult 2022. And now trades like a Tech stock with its highest earnings multiple ever, at around 53x.
Restaurant spending hit an all-time high, which sounds great for the Services sector. But under the surface, all is not well. Certainly, inflation is driving prices higher across the board, leading to higher revenues. But Mark Faber’s Gloom, Boom and Doom Report observes the struggles among “casual dining” restaurant chains. Labor and food bills have increased dramatically, forcing them to raise prices, and about 2 in 5 restaurants didn’t make a profit last year, according to Faber. Red Lobster has filed Chapter 11 bankruptcy. TGI Fridays, Boston Market, Cracker Barrel, and Appleby’s are struggling. Rubio’s Coastal Grill, a chain of 150 restaurants throughout Arizona, Nevada, and California from which I and my family has taken out many times, abruptly closed 48 under-performing locations throughout California citing the "rising cost of doing business in the state." The company cited "diminishing in-store traffic attributable to work-from-home practices remaining in place, and by rising food and utility costs that, combined with significant increases to the minimum wage in California, put pressure on a number of its locations.”
Fed policy:
So, again, I believe the Fed wants to start cutting rates (likely starting sometime in Q3), for reasons I have touched on many times in the past. They include averting a renewed banking crisis, as the number of problem banks rose from 52 in Q4 to 63 in Q1, and banks overall are estimated to have more than $500 billion in unrealized losses, mostly from years of purchasing longer duration bonds into an inverting yield curve. In addition, there is fallout from the commercial real estate depression, the growing rollover of speculative-grade debt, distortion in the critical housing market, the mirage of strong jobs growth (which has been propped up by government deficit spending and hiring rather than true organic growth), and of course the rising federal debt, debt service, and debt/GDP ratio (with 1/3 of the annual budget now earmarked to pay interest on the massive and rapidly growing federal debt), which threatens to choke off economic growth.
In addition, easing financial conditions would help highly indebted businesses, consumers, and our trading partners (particularly emerging markets). Indeed, yet another reason the Fed is prepared to cut is that so many other central banks have already started cutting, which further strengthens the dollar if the Fed stands pat (in fact, the dollar just hit a new YTD high). And then we have Japan, which needs to raise rates to support the yen but doesn’t really want to, given its huge debt load—it would be better for them if our Federal Reserve cuts instead.
I still believe a terminal fed funds rate of 3.0% would be the appropriate level so that borrowers can handle the debt burden while fixed income investors can receive a reasonable real yield (i.e., above the inflation rate) so they don’t have to take on undue risk to achieve meaningful income (like they had to do during the ZIRP years). As it stands today, assuming inflation is already much lower the reported (in real time, not lagged data), I think the real yield is too high—i.e., great for savers but bad for borrowers, which would suggest the Fed is behind the curve.
For example, the Fannie Mae Home Purchase Sentiment Index in May revealed that only 14% of consumers think it’s a good time to buy a home, hitting an all-time survey low. According to Infrastructure Capital Advisors, new housing inventory of 480,000 is approaching the peak during the Great Financial Crisis of 580,000. There is 9 months of new housing supply versus a recent average of 6 months. The GFC peak was 12 months. They point out that a “decline in the interest-sensitive housing and auto sectors in response to Fed tightening has caused 12 out of 12 post-WWII recessions.”
Nevertheless, even with rates still elevated today, I still believe any significant pullback in stocks would be a buying opportunity. Why? It’s all about investor expectations. As several commentators have opined, the US, warts and all, is the “best house in a lousy (global) neighborhood.” In an investment landscape fraught with danger nearly everywhere you turn, I see US stocks and bonds (including TIPS) as the places to be invested, particularly as the Fed and other central banks restore rising liquidity. Infrastructure Capital Advisors predicts a $2 trillion global injection to make rates go down across the yield curve.
Commodities also may be a good bet in this environment, including gold and crypto (as hedges against financial disruption or currency devaluation), silver (as an industrial metal), and copper (which is a primary industrial metal due to its electricity conductivity and the growing demand to power data centers for Gen AI). As for crypto, Michael Howell of CrossBorder Capital has opined that a strong dollar will still devalue relative to gold and bitcoin when liquidity rises, and gold price tends to rise faster than the rise in liquidity—and bitcoin has an even higher beta to liquidity.
Let’s look at a long-term chart of the ratio of the Dow Jones Industrial Average versus Gold (Dow/Gold) from Macrotends.net. On an inflation-adjusted basis, stocks peaked in December 2021. But the Dow/Gold Ratio topped in August 1999—and it seems to be rolling over once again as gold surges.

All in all, the economy and stocks are not as rosy as they may seem, and I reiterate my view that the Fed is well aware of all this and is eager to make a dovish pivot as soon as they have the data to justify it.
History shows that an economy that is sluggish but manages to avoid falling into recession tends to generate a strong financial market as policymakers are willing to inject liquidity, whereas an economy displaying robust growth can’t justify rate cuts or increased liquidity, so financial markets struggle. Of course, sluggish economic conditions tend to be hard on the working class, but the strong financial markets they generate are good for the investor class. In other words, those with access to capital markets make lots of money while those who live paycheck to paycheck or are otherwise shut out of the financial markets suffer. This can lead to class conflict. While the heavy hand of government intervention through tax rates, regulation, and monetary policy might be well intentioned (although many would argue that point), it usually hurts the “little guy” by hindering free markets and increasing the wealth gap.
Michael Howell of CrossBorder Capital has suggested that monetary inflation (driven by rising global liquidity) has far exceeded cost inflation through the years due to productivity gains, technological innovation, and China’s deflationary impact. He thinks today’s inflation is more like the 1940s when government spending fueled inflation rather than the 1970s when the private sector reacted to the removal of the gold standard. As liquidity rises, it suggests less systemic risk and justifies holding risk assets. He says M2 money supply is being driven by government fiscal deficit spending rather than private credit, and the banks are buying up that debt—and thereby essentially monetizing the debt.
As for the booming private credit market, it has soared from $433 billion in 2014 to $1.7 trillion in 2023, and this year it is on pace to eclipse $2 trillion. And why not, when they pay around 11% yields? But many private credit funds use as much as 200% leverage to increase their M&A investment activity, and most require investors 5-10-year lock-up periods. However, recent FOMC minutes have signaled the Fed’s view that credit conditions are tight and that the Fed may want to monitor the private credit market more closely.
Final comments:
As a follow-up to my discussion last month on the energy markets and the powerful growth in US exports of oil, LPG, and LNG, it is interesting to witness the continued consolidation wave to better leverage economies of scale, despite risking antitrust scrutiny. Most recently, ConocoPhillips (COP) just agreed to acquire Marathon Oil (MRO) in a $22.5 billion all-stock deal. ConocoPhillips will expand its geographical footprint into Eagle Ford, the Bakken Formation, and Equatorial Guinea. Other acquisitions announced over the past several months have included Chevron (CVX) buying Hess (HES) for $53 billion, Exxon (XOM) buying Pioneer Natural Resources (PXD) for $60 billion, and Diamondback Energy (FANG) buying fellow Permian Basin driller Endeavor Energy Resources for $26 billion. Also, Occidental Petroleum (OXY) and Apache (APA) have made acquisitions.
It all makes sense. The US is producing over 13 million bbls/day of crude oil, which is quite a bit more than any other country in the world, including Saudi Arabia. This is despite constraints on capital spending, which according to S&P Global, “reflects the material pull-back in natural gas activity levels, ongoing industry consolidation, and the continued improvement in drilling and completion (D&C) productivity and efficiency.” The strong production is also somewhat surprising given the hostile political environment around fossil fuels—although reducing inflation and talking up energy independence seem to be taking precedence in an election year. Regardless, high US production has helped keep gasoline prices in check and undermines the production limits and price-fixing efforts of OPEC and Russia (following its 2022 invasion of Ukraine).
S&P Global opined that oil & gas companies are much less focused on employing financial leverage to boost production than in those boom/bust days of yore, which better woos investors by offering cleaner balance sheets, strong free cash flow generation, rising dividends, and share buyback programs, while also justifying higher P/Es.
Let me wrap up with some political commentary. Given our country’s active military and financial interventionism around the world, BRICS nations (led by China and Russia) are attempting to forge a parallel economy free of US hegemony and are recruiting other nations that also might be resentful of our perceived heavy-handedness. Most recently, Saudi Arabia has cooperated by dropping its petrodollar deal with the US on its 50th anniversary, which had been put in place in the wake of the economic turmoil stemming from the US dropping the dollar gold standard (which had been pegged at $35 per ounce under the Bretton Woods Agreement) and the Arab oil embargo (which was retaliation for US support of Israel during the brief Yom Kippur War in 1973).
On the surface, this may seem like a real threat. But keep in mind, these two “superpowers” (China and Russia) are in decline in many ways, starting with demographics—given that their low birth rates, nonexistent immigration, and (in Russia) war-ravaged child-bearing population. Moreover, here is an optimistic opinion from Eric Peters of One River Asset Management in one of his recent market letters, “The US is in a stunningly strong position in such a world, if only it can get out of its own way and be true to its founding principles: Liberty, equality, democracy, Republicanism, rule of law, separation of powers, checks and balances, individual rights, Federalism, natural rights, limited government, judicial review. The demographic implosion underway in both Russia and China will not be filled by ambitious immigrants, who uproot their families for a better life under those systems. They’ll come here. This is America’s opportunity.”
Of course, we want immigrants to come through legal channels and be fully vetted. But the main point is, as long as America is the land of the free and the home of the brave, we will always be the beacon of hope for the world. So, let’s tamp down the radical self-hatred of our country, stop the petty, destructive, and distracting internal squabbling, embrace our founding principles, appreciate our unique strengths, institutions, and common interests, and focus on building unity as Americans to create a better tomorrow for ourselves and future generations (which, by extension, helps the rest of the world through free trade).
The past 8 years have seen both parties reject the legitimacy of the two elected presidents. Whether or not there was good reason, the fallout has been devastating. So, I suggest we all be skeptical of the partisan politicians, TV personalities, and social media influencers who profit from sowing discord and undermining cohesion, and whose only goal is solidifying power for their party or identity group rather than uplifting our nation as a whole. Vet their messages to be sure you aren’t being manipulated, propagandized, or “gaslighted.”
Moreover, let’s embrace Habit #5 of Steven Covey’s 7 Habits of Highly Effective People, “Seek first to understand, then to be understood.” Keeping an open mind may lead you to an epiphany and personal growth. Your neighbor, although perhaps misguided, is not evil simply by feeling differently about things. Refrain from the seven deadly sins: pride, greed, wrath, envy, lust, gluttony, and sloth—to which we are all susceptible from time to time—and embrace the Golden Rule: Do unto others as you would have them do unto you. For inspiration as to what is possible when people come together to pursue their common interests (and reject the siren song and ruinous creep of “big government,” socialism, authoritarianism, a weaponized justice system, and corrupt career politicians and media), look no further than the miraculous turnarounds taking place in El Salvador and Argentina.
Those countries are proving what our founding fathers knew and what we all have known (or should have known) all along—that the only proven way to create broad-based prosperity and reduce the wealth gap is through free market capitalism and meritocracy (which incentivizes robust growth of the economic “pie” through win-win transactions between willing buyers and sellers, employers and employees, sources of capital and sources of labor)—not bigger government and more handouts, which creates greater dependency by redistributing a stagnant or slow-growth economic pie through forced win-lose deals in which winners and losers are decided by government mandate.
During the pandemic, most of the public was willing to give up many of their individual freedoms and acquiesce to government control and mandates. But the more the government injects itself into our lives, the harder it is to remove it. Its tenacles are tenacious.
Not surprisingly, the European Union leadership suffered significant setbacks in the latest election in a backlash against its green-at-all-costs energy agenda, which has sent Europe into a death spiral of energy scarcity and falling standard of living. But the more resistance the European Parliament gets from its populace, the more forceful (and undemocratic) has been its reaction. I discussed Europe’s quasi-socialist governance, lack of innovation, and stagnant economy in my May post. Voters are now demanding that priorities be placed on national security, border security, energy security, and economic competitiveness over an uncertain ability to impact global climate change. Perhaps clean-burning LNG and restarting nuclear reactors will be part of the compromise solution.
It always irks me when I hear politicians (of all stripes) on the campaign trail bragging to interest groups (e.g., graduating college students, African-Americans, union workers, service workers, or whomever) about all the money printing & spending they have done (or will do) to benefit that group at the expense of other groups, and usually to the debt and detriment of society at large and future generations while fomenting imbalances, division, and resentment. I’d much prefer to hear them say instead, “I’m going to cut taxes, spending, crime, and regulations; reduce the size and scope of government; and restore your freedoms and constitutional rights.” Now, that would be refreshing.
The Financial Times recently reported, “The IMF’s second-in-command has urged the US to shrink its mounting fiscal burden, saying strong growth in the world’s largest economy gave it ‘ample’ room to rein in spending and raise taxes. Gita Gopinath, the fund’s first deputy managing director, said it was time for advanced economies to ‘invest in fiscal consolidation’ and address how they plan to bring debt burdens back down to pre-pandemic levels.”
As First Trust’s economics team wrote,
“It seems clear that if we step back, look at the size of federal, state, and local government debts – the fact that after trillions in spending we have not really improved poverty, nor have we addressed the inefficiencies in government – the system is broken.”
And as MacroStrategy Partnership in the UK recently opined, “More government, especially when deficit-funded, doesn’t solve problems, it is the problem; whilst government policies promoting equality (of outcome) risk a repeat of all the failures of totalitarian socialism. Whatever unequivocal good governments can do (rule of law, property rights, basic social security safety nets, etc.) these can be accounted for, tempered where necessary and voted on only when paid for out of tax. The empirical evidence is clear, chronic deficits severely erode economic growth. Academics, politicians and economists who remain silent about these rising debt-to-GDP trade-offs should be called out.” In other words, a call for more government is a call for more debt and less growth.
Here in the US, our GDP per capita has long been and continues to be the highest among the world’s largest economies. We have long been the international financial leader with the world’s reserve currency and (by far) the biggest equity and bond markets. We also are dominant in technology and innovation, which flourish under free market capitalism, the rule of law, IP protections, and immigration of many of the world’s best and brightest, as opposed to government-driven projects and institutions. As we plainly see throughout history and around the world, government is much better suited to regulation and oversight rather than driving innovation.
___
Sabrient Scorecards:
As a reminder, we have a new version of our quantitative Sabrient Scorecards due out shortly based on the investing strategies described in David Brown’s (soon to be launched) new book. The new Scorecard for Stocks is intended to help investors and advisors with stock search, fundamental screening, idea generation, risk monitoring, and confirmation, as well as portfolio construction for four specific investing styles: Growth, Value, Dividend, and Small Cap investing. The Scorecard for ETFs will continue in its current form. Both sheets will be posted weekly in Excel format and allow you to see how your stocks and ETFs rank in our system…or for identifying the top-ranked stocks and ETFs (or for weighted combinations of our alpha factors). I will be sending you a formal announcement on the launch of David’s book and the new Scorecards later this month!
For now, here is a link to the existing versions of our Scorecards (which are still free, for the moment):

Latest Sector Rankings:
Relative sector rankings are based on our proprietary SectorCast model, which builds a composite profile of each of over 1,000 equity ETFs based on bottom-up aggregate scoring of the constituent stocks. The Outlook Score is a Growth at a Reasonable Price (GARP) model that employs a forward-looking, fundamentals-based multifactor algorithm considering forward valuation, historical and projected earnings growth, the dynamics of Wall Street analysts’ consensus earnings estimates and recent revisions (up or down), quality and sustainability of reported earnings, and various return ratios. It helps us predict relative performance over the next 3-6 months.
In addition, SectorCast computes a Bull Score and Bear Score for each ETF based on recent price behavior of the constituent stocks on particularly strong and weak market days. A high Bull score indicates that stocks within the ETF recently have tended toward relative outperformance when the market is strong, while a high Bear score indicates that stocks within the ETF have tended to hold up relatively well (i.e., safe havens) when the market is weak. Outlook score is forward-looking while Bull and Bear are backward-looking.
As a group, these three scores can be helpful for positioning a portfolio for a given set of anticipated market conditions. Of course, each ETF holds a unique portfolio of stocks and position weights, so the sectors represented will score differently depending upon which set of ETFs is used. We use the iShares that represent the ten major U.S. business sectors: Financials (IYF), Technology (IYW), Industrials (IYJ), Healthcare (IYH), Consumer Staples (IYK), Consumer Discretionary (IYC), Energy (IYE), Basic Materials (IYM), Telecommunications (IYZ), and Utilities (IDU). Whereas the Select Sector SPDRs only contain stocks from the S&P 500 large cap index, I prefer the iShares for their larger universe and broader diversity.
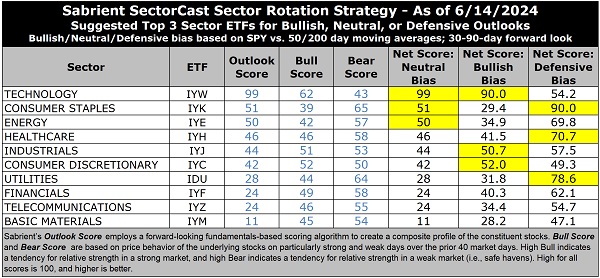
Like last month, I am displaying the full sector rotation table for your viewing pleasure. The latest fundamentals-based Outlook rankings display what I would call a neutral-to-defensive bias given that all-weather, secular-growth Technology stands alone at the top with near-perfect Outlook score of 99, and everything else is right at the neutral 50 level or lower, with a mix of cyclicals and non-cyclicals throughout. The most bullish rankings have cyclical sectors dominating the top of the rankings with scores well above 50. Despite having by far the highest forward P/E (bordering on extreme) of 30.5x, Technology (IYW) scores at the top in every other factor with strong forward EPS growth estimates (18.2%), a modest forward PEG (ratio of forward P/E to EPS growth) of 1.68, consistently positive earnings revisions from the Wall Street analyst community (+9%, while most other sectors are seeing flat or downward revisions to EPS), by far the best return ratios, and by far the best insider sentiment (open market buying).
Then, there’s a big drop-off to the next three who are bunched together: Consumer Staples (IYK) with an Outlook score of 51, Energy (IYE) at 50, and Healthcare (IYH) at 46. You can see that all have Bull scores well below 50 and solid Bear scores well above 50, which suggests they do better when the markets are defensive. Industrials (IYJ) rounds out the top 5 with a score of 44, followed closely by Consumer Discretionary (IYC), which are both cyclical sectors.
Notably, Energy and Telecom (IYZ) display the lowest forward P/Es at 11.9x and 11.7x, respectively, and Financials has the lowest forward PEG of 1.14 (forward P/E of 13.2x and EPS growth estimate of 11.5%). At the bottom remains Basic Materials (IYM) with negative earnings revisions, a relatively high forward P/E, and a meager projected growth rate of 7.4%.
Keep in mind, the Outlook Rank does not include timing, momentum, or relative strength factors, but rather reflects the consensus fundamental expectations at a given point in time for individual stocks, aggregated by sector.
ETF Trading Ideas:
Our rules-based Sector Rotation model, which appropriately weights Outlook, Bull, and Bear scores in accordance with the overall market’s prevailing trend (bullish, neutral, or defensive), retains its bullish bias as the market rally continues (despite the neutral-to-defensive turn in the SectorCast rankings). It was bullish from early November until the market pullback in mid-April when it shifted to neutral (for about 3 weeks) on the S&P 500’s confirmed close below its 50-day moving average. But the model moved back to bullish in early May on the strong close back above the 50-day.
The model continues to suggest holding Technology (IYW), Consumer Discretionary (IYC), and Industrials (IYJ), in that order. (Note: In this model, we consider the bias to be bullish from a rules-based trend-following standpoint when SPY is above both its 50-day and 200-day simple moving averages, but neutral if it is between those SMAs while searching for direction, and defensive if below both SMAs.)
If you prefer a neutral bias (given the overbought technicals and neutral bias of our quant rankings), the Sector Rotation model suggests holding Technology, Consumer Staples (IYK), and Energy (IYE). Or, if you prefer to take a defensive stance on the market, the model suggests holding Consumer Staples, Utilities (IDU), and Healthcare (IYH), in that order.
An assortment of other interesting ETFs that are scoring well in our latest rankings include: Invesco Building & Construction (PKB), Invesco Next Gen Media and Gaming (GGME), Innovator IBD 50 (FFTY), AdvisorShares Hotel (BEDZ), Fidelity Disruptive Communications (FDCF), AdvisorShares Gerber Kawasaki (GK), iShares Global Tech (IXN), BNY Mellon Innovators (BKIV), Roundhill Generative AI & Technology (CHAT), AdvisorShares Vice (VICE), iShares Expanded Tech Sector (IGM), Global X Social Media (SOCL), iShares US Tech Independence Focused (IETC), First Trust Innovation Leaders (ILDR), ProShares Global Listed Private Equity (PEX), Alerian MLP (AMLP), Fidelity Disruptive Technology (FDTX), Nuveen Growth Opportunities (NUGO), PGIM Jennison Better Future (PJBF), Invesco Golden Dragon China (PGJ), Simplify Volt RoboCar Disruption and Tech (VCAR), Hartford Large Cap Growth (HFGO), ProShares Nasdaq-100 Dorsey Wright Momentum (QQQA), WisdomTree US Quality Growth (QGRW), Invesco S&P SmallCap Materials (PSCM), iShares MSCI Global Gold Miners (RING), iShares Morningstar Growth (ILCG), SmartETFs Smart Transportation & Technology (MOTO), and Alger 35 (ATFV), and Inspire Fidelis Multi Factor (FDLS). All score in the top decile (90-100) of Outlook scores.
As always, I welcome your thoughts on this article! Please email me anytime. Any and all feedback is appreciated! In particular, please tell me what sections you find the most valuable—commentary, SectorCast scores, or ETF trading ideas / sector rotation model. Also, please let me know of your interest in:
1. a Sabrient index for ETF investing (we offer a 10-index Quality Index Series)
2. the Sabrient Scorecards with our full rankings of stocks and ETFs
3. having me speak at your event (topics include the economy and stock market, the energy sector, China’s economic situation, and career success secrets for new grads and young professionals)
More By This Author:
Investors Revel In A Goldilocks Outlook On Economy, Earnings, And Fed Policy
The Stock Market Rally Seems Overdone
Ducks Are Lining Up For FOMC Restraint And Continued Market


Comments
Log in or sign up to join the conversation.